
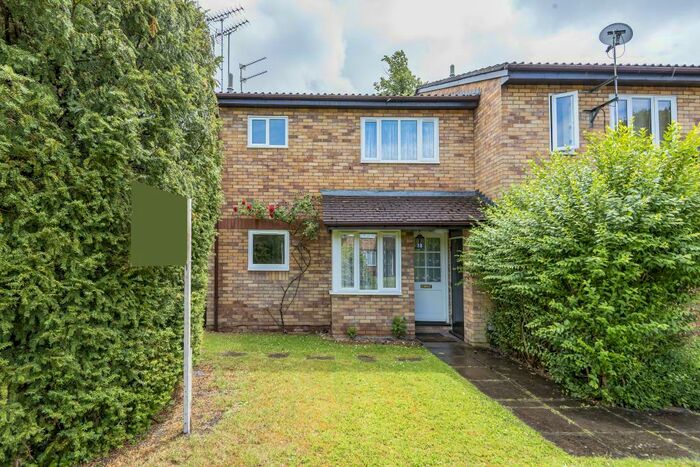
Houses for sale & to rent in Bracknell, Bracknell Forest
House Prices in Bracknell
Properties in Bracknell have an average house price of £405,942.00 and had 4,280 Property Transactions within the last 3 years.¹
Bracknell is an area in Bracknell Forest with 32,478 households², where the most expensive property was sold for £5,200,000.00.
Properties for sale in Bracknell


Neighbourhoods in Bracknell
Navigate through our locations to find the location of your next house in Bracknell, Bracknell Forest for sale or to rent.
- Ascot
- Binfield With Warfield
- Bullbrook
- Crown Wood
- Crowthorne
- Great Hollands North
- Great Hollands South
- Hanworth
- Harmans Water
- Old Bracknell
- Priestwood And Garth
- Warfield Harvest Ride
- Wildridings And Central
- Winkfield And Cranbourne
- Harmans Water & Crown Wood
- Town Centre & The Parks
- Binfield South & Jennett's Park
- Priestwood & Garth
- Binfield North & Warfield West
- Winkfield & Warfield East
Transport in Bracknell
Please see below transportation links in this area:
-
 Bracknell Station
 -
Martins Heron Station
-
Ascot Station
-
Wokingham Station
-
Crowthorne Station
-
Bagshot Station
- FAQ
- Price Paid By Year
- Property Type Price
Frequently asked questions about Bracknell
What is the average price for a property for sale in Bracknell?
The average price for a property for sale in Bracknell is £405,942. This amount is 9% lower than the average price in Bracknell Forest. There are more than 10,000 property listings for sale in Bracknell.
What locations have the most expensive properties for sale in Bracknell?
The locations with the most expensive properties for sale in Bracknell are Winkfield And Cranbourne at an average of £847,276, Binfield With Warfield at an average of £517,527 and Warfield Harvest Ride at an average of £464,495.
What locations have the most affordable properties for sale in Bracknell?
The locations with the most affordable properties for sale in Bracknell are Wildridings And Central at an average of £281,344, Hanworth at an average of £331,374 and Crown Wood at an average of £336,746.
Which train stations are available in or near Bracknell?
Some of the train stations available in or near Bracknell are Bracknell, Martins Heron and Ascot.
Property Price Paid in Bracknell by Year
The average sold property price by year was:
| Year | Average Sold Price | Price Change |
Sold Properties
|
|---|---|---|---|
| 2024 | £393,263 | -5% |
74 Properties |
| 2023 | £413,623 | -2% |
978 Properties |
| 2022 | £423,254 | 8% |
1,337 Properties |
| 2021 | £390,227 | 8% |
1,891 Properties |
| 2020 | £360,256 | -1% |
1,528 Properties |
| 2019 | £362,116 | 0,2% |
1,882 Properties |
| 2018 | £361,464 | 1% |
1,477 Properties |
| 2017 | £357,551 | 0,3% |
1,464 Properties |
| 2016 | £356,617 | 10% |
1,559 Properties |
| 2015 | £319,797 | 11% |
1,614 Properties |
| 2014 | £285,967 | 8% |
1,630 Properties |
| 2013 | £263,245 | 2% |
1,414 Properties |
| 2012 | £257,773 | 4% |
1,259 Properties |
| 2011 | £246,231 | -2% |
1,102 Properties |
| 2010 | £251,994 | 9% |
1,086 Properties |
| 2009 | £228,563 | -1% |
1,132 Properties |
| 2008 | £231,413 | -5% |
1,237 Properties |
| 2007 | £243,242 | 8% |
2,114 Properties |
| 2006 | £222,690 | 6% |
2,040 Properties |
| 2005 | £210,148 | 6% |
1,600 Properties |
| 2004 | £196,975 | 2% |
2,138 Properties |
| 2003 | £193,873 | 6% |
1,806 Properties |
| 2002 | £182,530 | 13% |
2,332 Properties |
| 2001 | £159,406 | 12% |
2,184 Properties |
| 2000 | £140,718 | 16% |
1,718 Properties |
| 1999 | £117,973 | 6% |
2,323 Properties |
| 1998 | £111,226 | 13% |
1,544 Properties |
| 1997 | £96,327 | 7% |
2,147 Properties |
| 1996 | £89,693 | 1% |
2,068 Properties |
| 1995 | £88,576 | - |
1,678 Properties |
Property Price per Property Type in Bracknell
Here you can find historic sold price data in order to help with your property search.
The average Property Paid Price for specific property types in the last three years are:
| Property Type | Average Sold Price | Sold Properties |
|---|---|---|
| Terraced House | £352,259.00 | 1,624 Terraced Houses |
| Flat | £225,785.00 | 946 Flats |
| Semi Detached House | £430,028.00 | 797 Semi Detached Houses |
| Detached House | £667,076.00 | 913 Detached Houses |