
Houses for sale & to rent in Nottingham, City of Nottingham
House Prices in Nottingham
Properties in Nottingham have an average house price of £200,268.00 and had 11,171 Property Transactions within the last 3 years.¹
Nottingham is an area in City of Nottingham with 115,096 households², where the most expensive property was sold for £2,060,000.00.
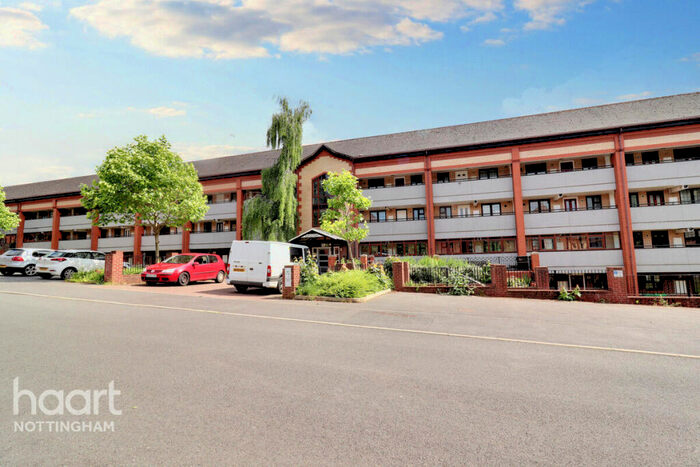
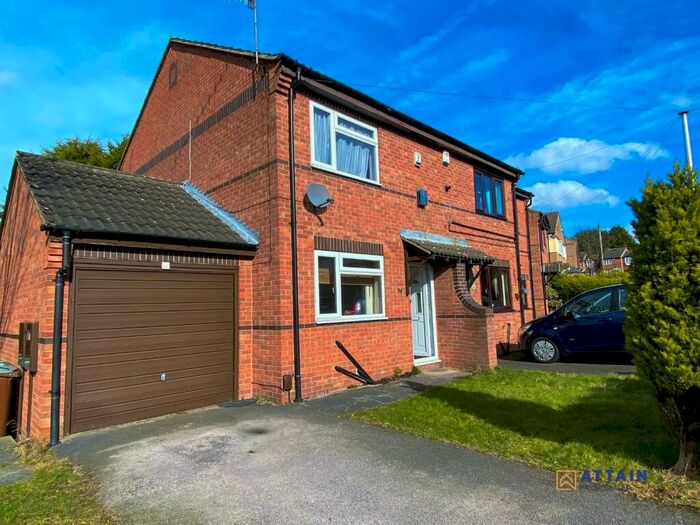
Properties for sale in Nottingham


Neighbourhoods in Nottingham
Navigate through our locations to find the location of your next house in Nottingham, City of Nottingham for sale or to rent.
- Meadows
- Arboretum
- Aspley
- Basford
- Berridge
- Bestwood
- Bilborough
- Bridge
- Bulwell
- Bulwell Forest
- Clifton North
- Clifton South
- Dales
- Dunkirk And Lenton
- Leen Valley
- Mapperley
- Radford And Park
- Sherwood
- St Anns
- Wollaton East And Lenton Abbey
- Wollaton West
- Colwick
- Compton Acres
- Beeston Central
- Daybrook
- Hyson Green & Arboretum
- Clifton West
- Lenton & Wollaton East
Transport in Nottingham
Please see below transportation links in this area:
-
 Nottingham Station
 -
Bulwell Station
-
Beeston Station
-
Netherfield Station
-
Carlton Station
-
Attenborough Station
- FAQ
- Price Paid By Year
- Property Type Price
Frequently asked questions about Nottingham
What is the average price for a property for sale in Nottingham?
The average price for a property for sale in Nottingham is £200,268. There are more than 10,000 property listings for sale in Nottingham.
What locations have the most expensive properties for sale in Nottingham?
The locations with the most expensive properties for sale in Nottingham are Compton Acres at an average of £430,000, Wollaton West at an average of £351,862 and Radford And Park at an average of £277,797.
What locations have the most affordable properties for sale in Nottingham?
The locations with the most affordable properties for sale in Nottingham are St Anns at an average of £141,987, Bulwell at an average of £144,793 and Aspley at an average of £148,954.
Which train stations are available in or near Nottingham?
Some of the train stations available in or near Nottingham are Nottingham, Bulwell and Beeston.
Property Price Paid in Nottingham by Year
The average sold property price by year was:
| Year | Average Sold Price | Price Change |
Sold Properties
|
|---|---|---|---|
| 2024 | £206,326 | -1% |
183 Properties |
| 2023 | £208,241 | 3% |
2,900 Properties |
| 2022 | £201,841 | 4% |
3,857 Properties |
| 2021 | £193,107 | 9% |
4,231 Properties |
| 2020 | £175,731 | 11% |
3,247 Properties |
| 2019 | £157,035 | -1% |
4,256 Properties |
| 2018 | £159,088 | 6% |
4,311 Properties |
| 2017 | £149,331 | 7% |
4,202 Properties |
| 2016 | £139,543 | 5% |
4,216 Properties |
| 2015 | £132,504 | 3% |
4,067 Properties |
| 2014 | £128,445 | 7% |
3,978 Properties |
| 2013 | £119,632 | 0,5% |
3,023 Properties |
| 2012 | £119,044 | 1% |
2,517 Properties |
| 2011 | £118,047 | -3% |
2,629 Properties |
| 2010 | £121,264 | -3% |
2,750 Properties |
| 2009 | £124,392 | -1% |
2,609 Properties |
| 2008 | £125,290 | -3% |
3,112 Properties |
| 2007 | £129,248 | 1% |
6,015 Properties |
| 2006 | £128,460 | 2% |
5,953 Properties |
| 2005 | £125,417 | 5% |
4,982 Properties |
| 2004 | £118,930 | 11% |
6,171 Properties |
| 2003 | £105,982 | 20% |
6,009 Properties |
| 2002 | £84,574 | 20% |
6,233 Properties |
| 2001 | £67,664 | 13% |
5,594 Properties |
| 2000 | £58,651 | 6% |
4,895 Properties |
| 1999 | £55,170 | 7% |
4,377 Properties |
| 1998 | £51,282 | 5% |
4,060 Properties |
| 1997 | £48,836 | 5% |
4,131 Properties |
| 1996 | £46,305 | 2% |
3,602 Properties |
| 1995 | £45,181 | - |
3,196 Properties |
Property Price per Property Type in Nottingham
Here you can find historic sold price data in order to help with your property search.
The average Property Paid Price for specific property types in the last three years are:
| Property Type | Average Sold Price | Sold Properties |
|---|---|---|
| Terraced House | £164,849.00 | 4,388 Terraced Houses |
| Flat | £159,412.00 | 1,759 Flats |
| Semi Detached House | £202,789.00 | 3,401 Semi Detached Houses |
| Detached House | £335,021.00 | 1,623 Detached Houses |