
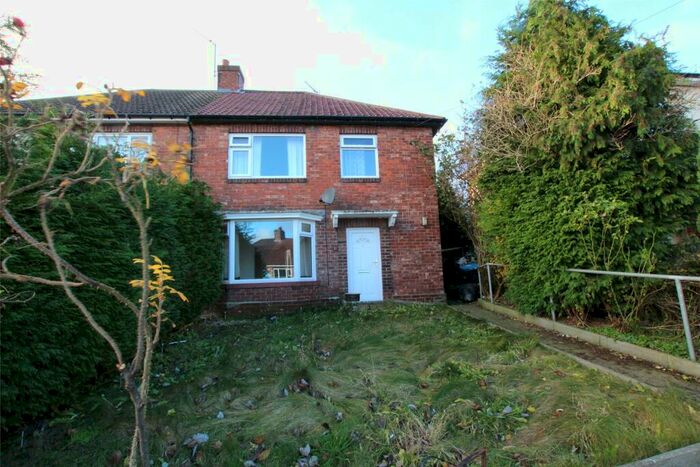
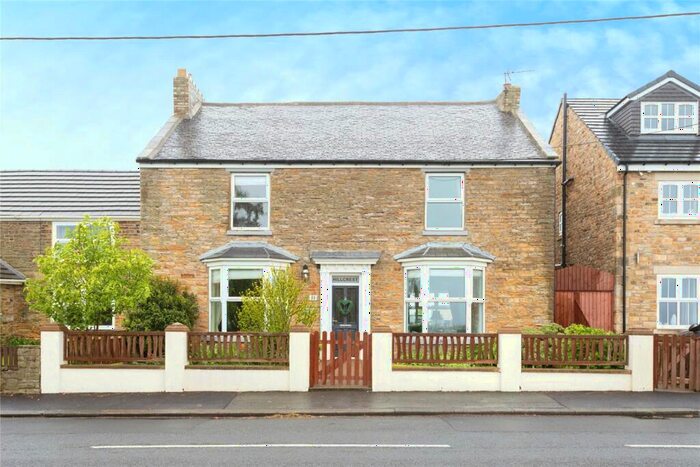
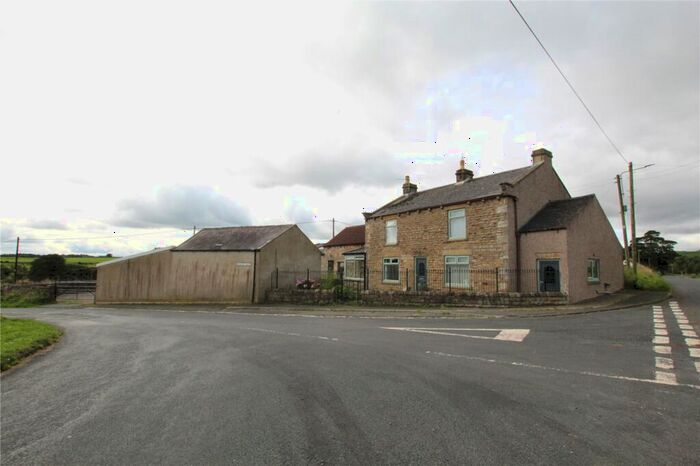
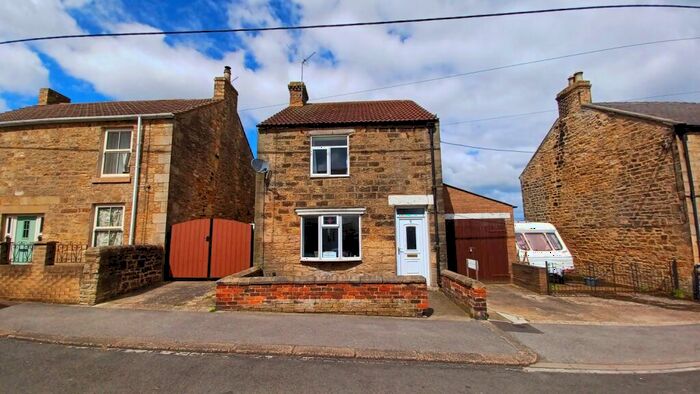
Houses for sale & to rent in Bishop Auckland, County Durham
House Prices in Bishop Auckland
Properties in Bishop Auckland have an average house price of £126,973.00 and had 3,131 Property Transactions within the last 3 years.¹
Bishop Auckland is an area in County Durham with 23,015 households², where the most expensive property was sold for £768,000.00.
Properties for sale in Bishop Auckland


Neighbourhoods in Bishop Auckland
Navigate through our locations to find the location of your next house in Bishop Auckland, County Durham for sale or to rent.
Transport in Bishop Auckland
Please see below transportation links in this area:
-
 Bishop Auckland Station
 -
Shildon Station
-
Newton Aycliffe Station
-
Heighington Station
-
Durham Station
-
North Road Station
- FAQ
- Price Paid By Year
- Property Type Price
Frequently asked questions about Bishop Auckland
What is the average price for a property for sale in Bishop Auckland?
The average price for a property for sale in Bishop Auckland is £126,973. This amount is 9% lower than the average price in County Durham. There are more than 10,000 property listings for sale in Bishop Auckland.
What locations have the most expensive properties for sale in Bishop Auckland?
The locations with the most expensive properties for sale in Bishop Auckland are Spennymoor at an average of £265,000, Esh And Witton Gilbert at an average of £241,950 and Weardale at an average of £214,440.
What locations have the most affordable properties for sale in Bishop Auckland?
The locations with the most affordable properties for sale in Bishop Auckland are Shildon And Dene Valley at an average of £72,994, Woodhouse Close at an average of £98,045 and Coundon at an average of £98,669.
Which train stations are available in or near Bishop Auckland?
Some of the train stations available in or near Bishop Auckland are Bishop Auckland, Shildon and Newton Aycliffe.
Property Price Paid in Bishop Auckland by Year
The average sold property price by year was:
| Year | Average Sold Price | Price Change |
Sold Properties
|
|---|---|---|---|
| 2024 | £125,156 | 4% |
80 Properties |
| 2023 | £120,654 | -8% |
834 Properties |
| 2022 | £129,871 | 1% |
1,017 Properties |
| 2021 | £129,029 | 6% |
1,200 Properties |
| 2020 | £120,859 | 8% |
830 Properties |
| 2019 | £111,167 | -3% |
869 Properties |
| 2018 | £115,046 | - |
881 Properties |
| 2017 | £115,055 | 9% |
996 Properties |
| 2016 | £104,140 | 2% |
955 Properties |
| 2015 | £101,982 | -4% |
834 Properties |
| 2014 | £106,034 | 2% |
820 Properties |
| 2013 | £103,701 | -6% |
612 Properties |
| 2012 | £109,589 | -5% |
513 Properties |
| 2011 | £115,381 | -7% |
534 Properties |
| 2010 | £122,985 | 8% |
601 Properties |
| 2009 | £113,327 | -9% |
565 Properties |
| 2008 | £123,584 | 1% |
788 Properties |
| 2007 | £122,580 | 3% |
1,380 Properties |
| 2006 | £118,328 | 8% |
1,263 Properties |
| 2005 | £109,187 | 9% |
1,048 Properties |
| 2004 | £98,950 | 23% |
1,240 Properties |
| 2003 | £76,641 | 15% |
1,221 Properties |
| 2002 | £64,882 | 21% |
1,273 Properties |
| 2001 | £51,222 | -5% |
1,030 Properties |
| 2000 | £53,693 | -1% |
922 Properties |
| 1999 | £54,382 | 10% |
945 Properties |
| 1998 | £49,059 | 2% |
833 Properties |
| 1997 | £47,968 | 7% |
826 Properties |
| 1996 | £44,829 | 2% |
773 Properties |
| 1995 | £44,136 | - |
768 Properties |
Property Price per Property Type in Bishop Auckland
Here you can find historic sold price data in order to help with your property search.
The average Property Paid Price for specific property types in the last three years are:
| Property Type | Average Sold Price | Sold Properties |
|---|---|---|
| Terraced House | £83,399.00 | 1,803 Terraced Houses |
| Flat | £80,110.00 | 81 Flats |
| Semi Detached House | £137,550.00 | 662 Semi Detached Houses |
| Detached House | £255,787.00 | 585 Detached Houses |