
Houses for sale & to rent in Newcastle Upon Tyne, County Durham
House Prices in Newcastle Upon Tyne
Properties in Newcastle Upon Tyne have an average house price of £163,747.00 and had 339 Property Transactions within the last 3 years.¹
Newcastle Upon Tyne is an area in County Durham with 2,712 households², where the most expensive property was sold for £765,000.00.
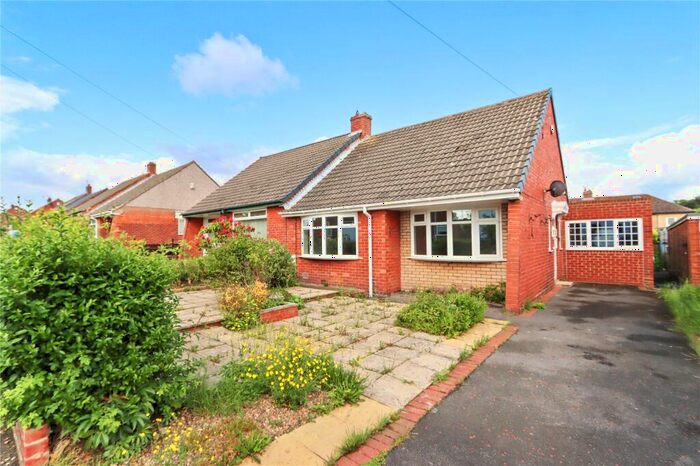
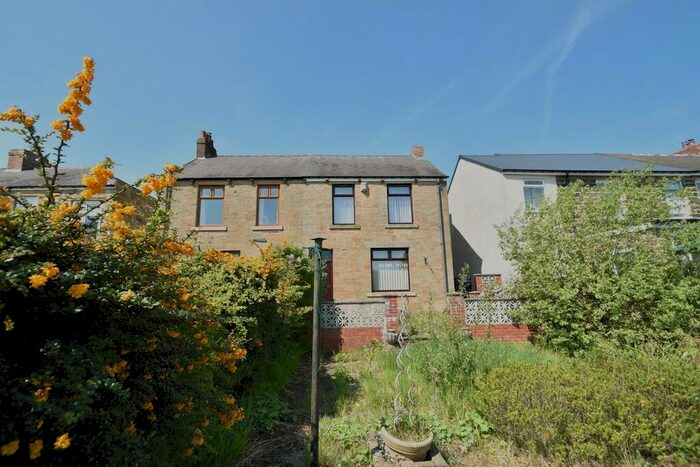
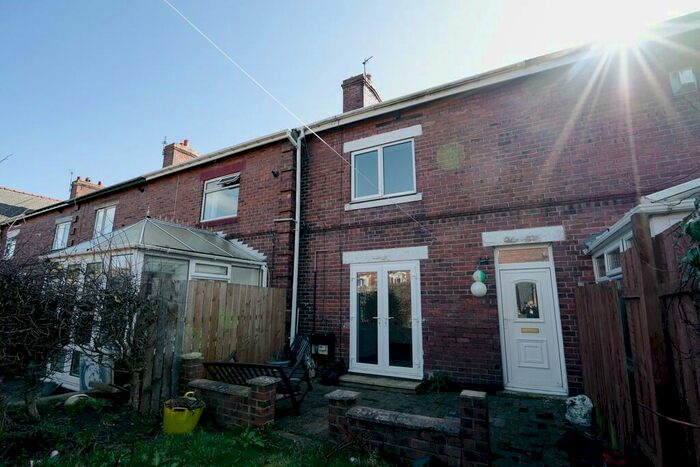
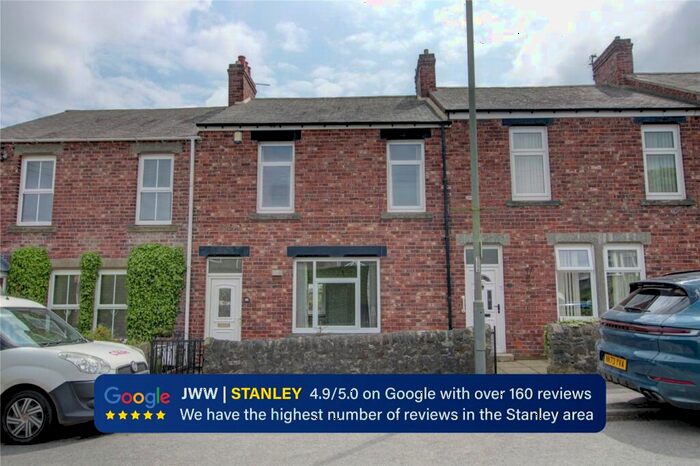
Properties for sale in Newcastle Upon Tyne


Neighbourhoods in Newcastle Upon Tyne
Navigate through our locations to find the location of your next house in Newcastle Upon Tyne, County Durham for sale or to rent.
Transport in Newcastle Upon Tyne
Please see below transportation links in this area:
-
 Blaydon Station
 -
MetroCentre Station
-
Dunston Station
-
Wylam Station
-
Prudhoe Station
-
Newcastle Station
-
Stocksfield Station
-
Manors Station
-
Chester-Le-Street Station
-
Heworth Station
- FAQ
- Price Paid By Year
- Property Type Price
Frequently asked questions about Newcastle Upon Tyne
What is the average price for a property for sale in Newcastle Upon Tyne?
The average price for a property for sale in Newcastle Upon Tyne is £163,747. This amount is 16% higher than the average price in County Durham. There are 2,654 property listings for sale in Newcastle Upon Tyne.
What locations have the most expensive properties for sale in Newcastle Upon Tyne?
The location with the most expensive properties for sale in Newcastle Upon Tyne is Leadgate And Medomsley at an average of £187,272.
What locations have the most affordable properties for sale in Newcastle Upon Tyne?
The location with the most affordable properties for sale in Newcastle Upon Tyne is Burnopfield And Dipton at an average of £157,104.
Which train stations are available in or near Newcastle Upon Tyne?
Some of the train stations available in or near Newcastle Upon Tyne are Blaydon, MetroCentre and Dunston.
Property Price Paid in Newcastle Upon Tyne by Year
The average sold property price by year was:
| Year | Average Sold Price | Price Change |
Sold Properties
|
|---|---|---|---|
| 2024 | £161,640 | -4% |
5 Properties |
| 2023 | £167,774 | 8% |
73 Properties |
| 2022 | £153,601 | -11% |
121 Properties |
| 2021 | £170,492 | 14% |
140 Properties |
| 2020 | £146,324 | -6% |
100 Properties |
| 2019 | £155,555 | 8% |
114 Properties |
| 2018 | £142,950 | -2% |
96 Properties |
| 2017 | £145,370 | 5% |
117 Properties |
| 2016 | £138,233 | -3% |
124 Properties |
| 2015 | £142,600 | 8% |
140 Properties |
| 2014 | £131,301 | -1% |
110 Properties |
| 2013 | £132,516 | -7% |
89 Properties |
| 2012 | £141,733 | 2% |
58 Properties |
| 2011 | £138,540 | 1% |
60 Properties |
| 2010 | £137,732 | 1% |
72 Properties |
| 2009 | £136,151 | -4% |
90 Properties |
| 2008 | £142,054 | -4% |
82 Properties |
| 2007 | £147,619 | 2% |
169 Properties |
| 2006 | £145,244 | 7% |
162 Properties |
| 2005 | £135,787 | 5% |
113 Properties |
| 2004 | £129,013 | 23% |
134 Properties |
| 2003 | £99,661 | 8% |
168 Properties |
| 2002 | £91,831 | 21% |
237 Properties |
| 2001 | £72,468 | 5% |
176 Properties |
| 2000 | £68,484 | 19% |
161 Properties |
| 1999 | £55,359 | 7% |
108 Properties |
| 1998 | £51,548 | 3% |
96 Properties |
| 1997 | £50,067 | 12% |
98 Properties |
| 1996 | £43,912 | -14% |
83 Properties |
| 1995 | £50,045 | - |
70 Properties |
Property Price per Property Type in Newcastle Upon Tyne
Here you can find historic sold price data in order to help with your property search.
The average Property Paid Price for specific property types in the last three years are:
| Property Type | Average Sold Price | Sold Properties |
|---|---|---|
| Flat | £89,583.00 | 18 Flats |
| Semi Detached House | £154,912.00 | 98 Semi Detached Houses |
| Terraced House | £124,111.00 | 157 Terraced Houses |
| Detached House | £291,378.00 | 66 Detached Houses |