
Houses for sale & to rent in Maryport, Cumbria
House Prices in Maryport
Properties in Maryport have an average house price of £140,709.00 and had 735 Property Transactions within the last 3 years.¹
Maryport is an area in Cumbria with 7,002 households², where the most expensive property was sold for £525,000.00.
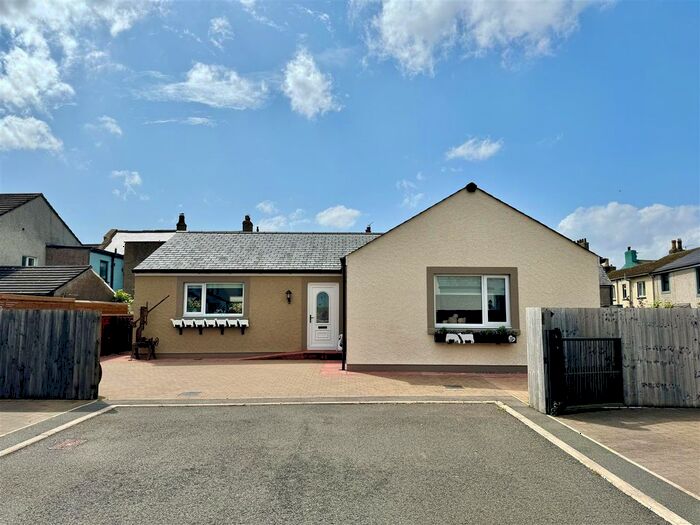
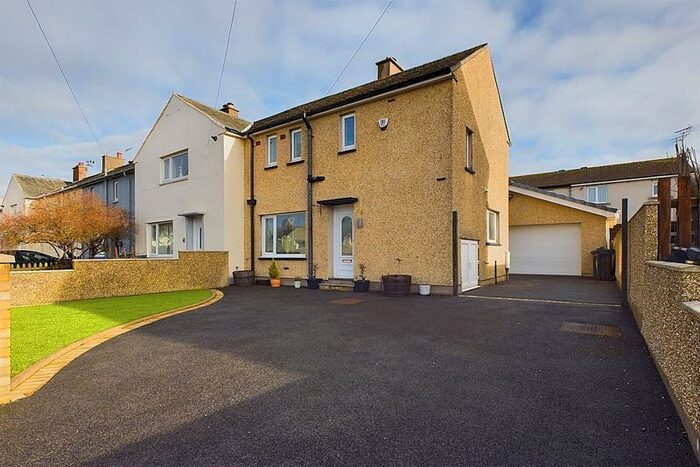
Properties for sale in Maryport


Neighbourhoods in Maryport
Navigate through our locations to find the location of your next house in Maryport, Cumbria for sale or to rent.
Transport in Maryport
Please see below transportation links in this area:

- FAQ
- Price Paid By Year
- Property Type Price
Frequently asked questions about Maryport
What is the average price for a property for sale in Maryport?
The average price for a property for sale in Maryport is £140,709. This amount is 43% lower than the average price in Cumbria. There are 3,168 property listings for sale in Maryport.
What locations have the most expensive properties for sale in Maryport?
The locations with the most expensive properties for sale in Maryport are Silloth & Solway Coast at an average of £200,000, Ellen at an average of £177,806 and Ellen & Gilcrux at an average of £177,502.
What locations have the most affordable properties for sale in Maryport?
The locations with the most affordable properties for sale in Maryport are Maryport South at an average of £73,250, Flimby at an average of £102,643 and Maryport North at an average of £115,625.
Which train stations are available in or near Maryport?
Some of the train stations available in or near Maryport are Maryport, Flimby and Workington.
Property Price Paid in Maryport by Year
The average sold property price by year was:
| Year | Average Sold Price | Price Change |
Sold Properties
|
|---|---|---|---|
| 2024 | £138,922 | -9% |
20 Properties |
| 2023 | £150,772 | 5% |
184 Properties |
| 2022 | £143,009 | 7% |
222 Properties |
| 2021 | £133,179 | 0,2% |
309 Properties |
| 2020 | £132,926 | 5% |
210 Properties |
| 2019 | £126,646 | -1% |
209 Properties |
| 2018 | £127,692 | 2% |
239 Properties |
| 2017 | £124,554 | -3% |
266 Properties |
| 2016 | £128,275 | 4% |
274 Properties |
| 2015 | £123,238 | 2% |
264 Properties |
| 2014 | £121,312 | 4% |
246 Properties |
| 2013 | £116,758 | 4% |
227 Properties |
| 2012 | £112,218 | 4% |
141 Properties |
| 2011 | £108,239 | -16% |
170 Properties |
| 2010 | £125,143 | 9% |
158 Properties |
| 2009 | £113,830 | -3% |
138 Properties |
| 2008 | £116,971 | -11% |
172 Properties |
| 2007 | £129,393 | 15% |
324 Properties |
| 2006 | £110,122 | 7% |
319 Properties |
| 2005 | £102,174 | 18% |
271 Properties |
| 2004 | £83,295 | 16% |
294 Properties |
| 2003 | £70,057 | 25% |
373 Properties |
| 2002 | £52,880 | 13% |
333 Properties |
| 2001 | £45,798 | 9% |
306 Properties |
| 2000 | £41,876 | -1% |
262 Properties |
| 1999 | £42,329 | 4% |
241 Properties |
| 1998 | £40,552 | 5% |
219 Properties |
| 1997 | £38,503 | -0,3% |
275 Properties |
| 1996 | £38,603 | 0,3% |
231 Properties |
| 1995 | £38,469 | - |
190 Properties |
Property Price per Property Type in Maryport
Here you can find historic sold price data in order to help with your property search.
The average Property Paid Price for specific property types in the last three years are:
| Property Type | Average Sold Price | Sold Properties |
|---|---|---|
| Semi Detached House | £152,058.00 | 168 Semi Detached Houses |
| Terraced House | £105,507.00 | 411 Terraced Houses |
| Detached House | £234,939.00 | 141 Detached Houses |
| Flat | £92,366.00 | 15 Flats |