
Houses for sale & to rent in Newent, Gloucestershire
House Prices in Newent
Properties in Newent have an average house price of £319,166.00 and had 354 Property Transactions within the last 3 years.¹
Newent is an area in Gloucestershire with 2,683 households², where the most expensive property was sold for £1,650,000.00.
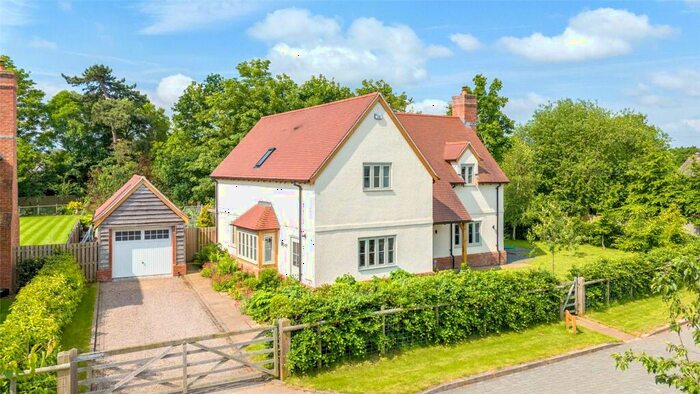
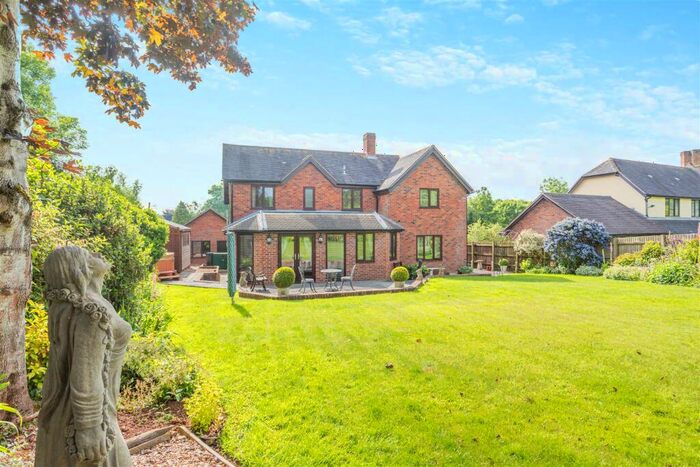
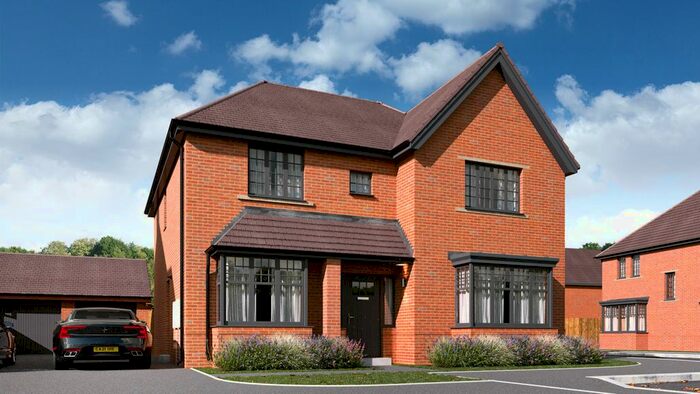
Properties for sale in Newent


Neighbourhoods in Newent
Navigate through our locations to find the location of your next house in Newent, Gloucestershire for sale or to rent.
Transport in Newent
Please see below transportation links in this area:
-
 Ledbury Station
 -
Gloucester Station
-
Colwall Station
-
Great Malvern Station
-
Cheltenham Spa Station
-
Ashchurch Station
-
Stonehouse Station
-
Malvern Link Station
-
Cam and Dursley Station
- FAQ
- Price Paid By Year
- Property Type Price
Frequently asked questions about Newent
What is the average price for a property for sale in Newent?
The average price for a property for sale in Newent is £319,166. This amount is 13% lower than the average price in Gloucestershire. There are 1,048 property listings for sale in Newent.
What locations have the most expensive properties for sale in Newent?
The locations with the most expensive properties for sale in Newent are Hartpury at an average of £697,215, Tibberton at an average of £517,273 and Oxenhall And Newent North East at an average of £413,157.
What locations have the most affordable properties for sale in Newent?
The locations with the most affordable properties for sale in Newent are Newent Central at an average of £262,920, Bromesberrow And Dymock at an average of £308,750 and Newent & Taynton at an average of £364,935.
Which train stations are available in or near Newent?
Some of the train stations available in or near Newent are Ledbury, Gloucester and Colwall.
Property Price Paid in Newent by Year
The average sold property price by year was:
| Year | Average Sold Price | Price Change |
Sold Properties
|
|---|---|---|---|
| 2024 | £306,994 | 2% |
10 Properties |
| 2023 | £301,465 | -10% |
81 Properties |
| 2022 | £332,297 | 4% |
109 Properties |
| 2021 | £319,973 | 18% |
154 Properties |
| 2020 | £260,835 | 2% |
109 Properties |
| 2019 | £254,783 | 6% |
110 Properties |
| 2018 | £240,662 | 3% |
117 Properties |
| 2017 | £233,049 | 5% |
157 Properties |
| 2016 | £220,751 | 7% |
129 Properties |
| 2015 | £205,639 | -2% |
107 Properties |
| 2014 | £210,161 | 4% |
150 Properties |
| 2013 | £201,815 | -7% |
126 Properties |
| 2012 | £215,191 | -1% |
113 Properties |
| 2011 | £218,147 | 6% |
126 Properties |
| 2010 | £206,123 | -2% |
102 Properties |
| 2009 | £209,644 | -14% |
88 Properties |
| 2008 | £238,627 | 4% |
76 Properties |
| 2007 | £229,877 | 10% |
127 Properties |
| 2006 | £205,915 | 3% |
120 Properties |
| 2005 | £199,052 | 1% |
91 Properties |
| 2004 | £197,564 | 17% |
98 Properties |
| 2003 | £164,795 | 13% |
118 Properties |
| 2002 | £143,492 | 19% |
137 Properties |
| 2001 | £116,519 | 14% |
115 Properties |
| 2000 | £100,134 | 6% |
98 Properties |
| 1999 | £94,274 | 14% |
138 Properties |
| 1998 | £81,303 | 8% |
88 Properties |
| 1997 | £74,426 | 1% |
117 Properties |
| 1996 | £73,409 | 1% |
111 Properties |
| 1995 | £72,688 | - |
89 Properties |
Property Price per Property Type in Newent
Here you can find historic sold price data in order to help with your property search.
The average Property Paid Price for specific property types in the last three years are:
| Property Type | Average Sold Price | Sold Properties |
|---|---|---|
| Flat | £137,660.00 | 15 Flats |
| Semi Detached House | £249,671.00 | 96 Semi Detached Houses |
| Terraced House | £227,239.00 | 87 Terraced Houses |
| Detached House | £430,652.00 | 156 Detached Houses |