
Houses for sale & to rent in Andover, Hampshire
House Prices in Andover
Properties in Andover have an average house price of £366,458.00 and had 3,183 Property Transactions within the last 3 years.¹
Andover is an area in Hampshire with 23,614 households², where the most expensive property was sold for £6,500,000.00.
Properties for sale in Andover


Neighbourhoods in Andover
Navigate through our locations to find the location of your next house in Andover, Hampshire for sale or to rent.
- Alamein
- Amport
- Anna
- Bourne Valley
- Burghclere, Highclere And St Mary Bourne
- Charlton
- Harewood
- Harroway
- Millway
- Over Wallop
- Penton Bellinger
- St Marys
- Whitchurch
- Winton
- Bellinger
- Andover St Mary's
- Andover Winton
- Andover Millway
- Andover Harroway
- Charlton & the Pentons
- Andover Downlands
- Andover Romans
- Evingar
Transport in Andover
Please see below transportation links in this area:

- FAQ
- Price Paid By Year
- Property Type Price
Frequently asked questions about Andover
What is the average price for a property for sale in Andover?
The average price for a property for sale in Andover is £366,458. This amount is 13% lower than the average price in Hampshire. There are 7,833 property listings for sale in Andover.
What locations have the most expensive properties for sale in Andover?
The locations with the most expensive properties for sale in Andover are Burghclere, Highclere And St Mary Bourne at an average of £754,842, Bourne Valley at an average of £738,046 and Over Wallop at an average of £729,500.
What locations have the most affordable properties for sale in Andover?
The locations with the most affordable properties for sale in Andover are St Marys at an average of £253,159, Andover Harroway at an average of £267,466 and Andover St Mary's at an average of £271,772.
Which train stations are available in or near Andover?
Some of the train stations available in or near Andover are Andover, Grateley and Whitchurch (Hampshire).
Property Price Paid in Andover by Year
The average sold property price by year was:
| Year | Average Sold Price | Price Change |
Sold Properties
|
|---|---|---|---|
| 2024 | £321,189 | -17% |
64 Properties |
| 2023 | £375,421 | -4% |
712 Properties |
| 2022 | £390,307 | 11% |
1,012 Properties |
| 2021 | £346,659 | 7% |
1,395 Properties |
| 2020 | £323,510 | 8% |
1,091 Properties |
| 2019 | £296,256 | -2% |
1,273 Properties |
| 2018 | £303,431 | 2% |
1,239 Properties |
| 2017 | £298,401 | 6% |
1,311 Properties |
| 2016 | £281,068 | 6% |
1,265 Properties |
| 2015 | £264,740 | 5% |
1,346 Properties |
| 2014 | £251,941 | 2% |
1,237 Properties |
| 2013 | £247,508 | 2% |
982 Properties |
| 2012 | £243,423 | -2% |
776 Properties |
| 2011 | £247,801 | -5% |
756 Properties |
| 2010 | £260,564 | 5% |
694 Properties |
| 2009 | £246,720 | - |
653 Properties |
| 2008 | £246,630 | -1% |
626 Properties |
| 2007 | £248,009 | 10% |
1,230 Properties |
| 2006 | £224,225 | 6% |
1,349 Properties |
| 2005 | £211,578 | 6% |
1,142 Properties |
| 2004 | £199,350 | 3% |
1,318 Properties |
| 2003 | £194,276 | 13% |
1,451 Properties |
| 2002 | £169,415 | 13% |
1,627 Properties |
| 2001 | £147,883 | 7% |
1,331 Properties |
| 2000 | £137,937 | 19% |
1,175 Properties |
| 1999 | £111,803 | 9% |
1,542 Properties |
| 1998 | £101,646 | 13% |
1,282 Properties |
| 1997 | £88,865 | 6% |
1,416 Properties |
| 1996 | £83,968 | 2% |
1,254 Properties |
| 1995 | £82,662 | - |
886 Properties |
Property Price per Property Type in Andover
Here you can find historic sold price data in order to help with your property search.
The average Property Paid Price for specific property types in the last three years are:
| Property Type | Average Sold Price | Sold Properties |
|---|---|---|
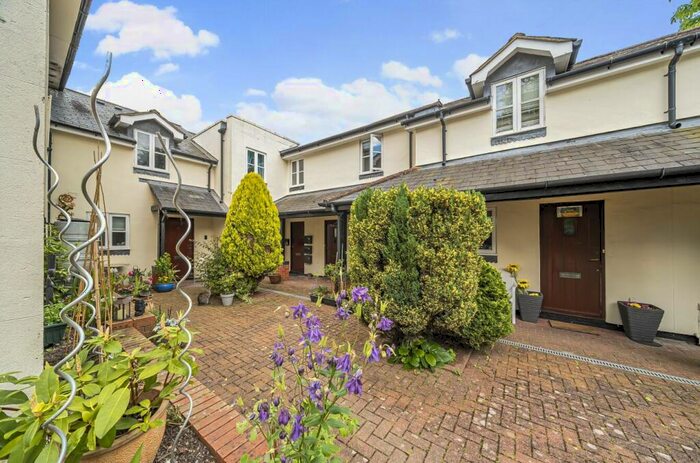
| Terraced House | £259,770.00 | 923 Terraced Houses |
| Flat | £172,402.00 | 417 Flats |
| Semi Detached House | £321,930.00 | 847 Semi Detached Houses |
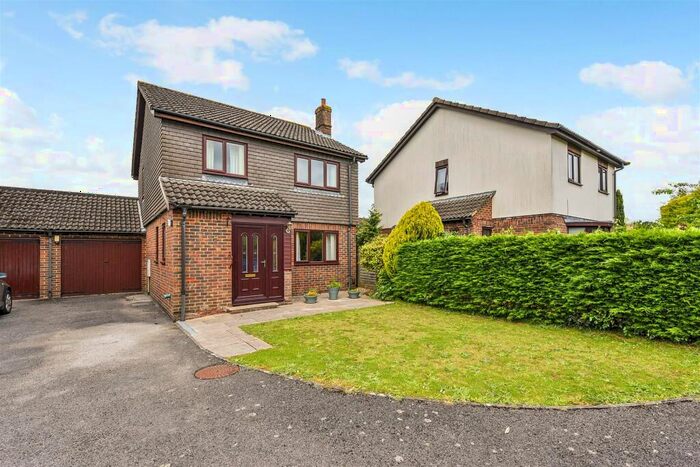
| Detached House | £584,440.00 | 996 Detached Houses |