
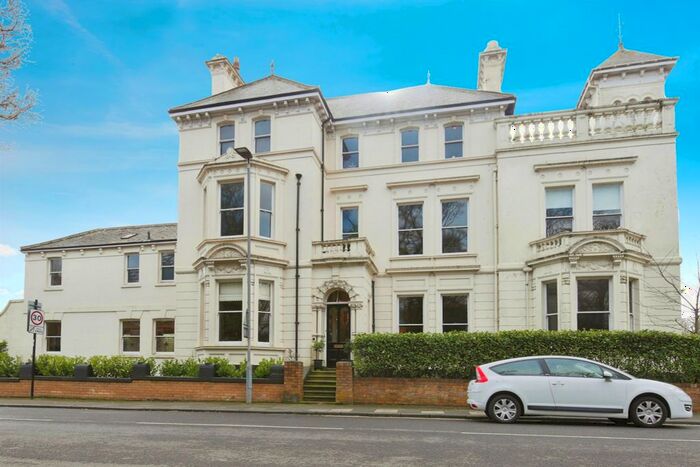
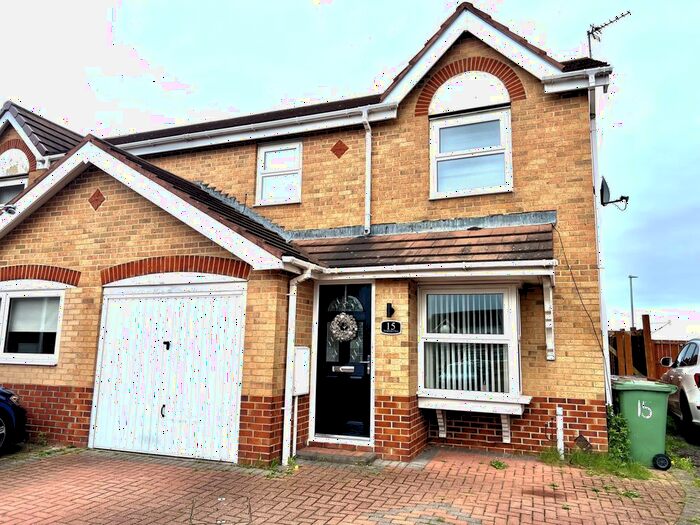
Houses for sale & to rent in Hartlepool, Hartlepool
House Prices in Hartlepool
Properties in Hartlepool have an average house price of £128,141.00 and had 5,166 Property Transactions within the last 3 years.¹
Hartlepool is an area in Hartlepool with 40,180 households², where the most expensive property was sold for £986,455.00.
Properties for sale in Hartlepool


Neighbourhoods in Hartlepool
Navigate through our locations to find the location of your next house in Hartlepool, Hartlepool for sale or to rent.
Transport in Hartlepool
Please see below transportation links in this area:
-
 Hartlepool Station
 -
Seaton Carew Station
-
Billingham Station
-
British Steel Redcar Station
-
South Bank Station
-
Middlesbrough Station
-
Redcar Central Station
-
Redcar East Station
-
Stockton Station
-
James Cook University Hospital Station
- FAQ
- Price Paid By Year
- Property Type Price
Frequently asked questions about Hartlepool
What is the average price for a property for sale in Hartlepool?
The average price for a property for sale in Hartlepool is £128,141. This amount is 6% lower than the average price in Hartlepool. There are 5,016 property listings for sale in Hartlepool.
What locations have the most expensive properties for sale in Hartlepool?
The locations with the most expensive properties for sale in Hartlepool are Rural West at an average of £295,455, Hart at an average of £190,711 and Fens & Greatham at an average of £170,700.
What locations have the most affordable properties for sale in Hartlepool?
The locations with the most affordable properties for sale in Hartlepool are Victoria at an average of £68,674, Throston at an average of £70,620 and Manor House at an average of £85,854.
Which train stations are available in or near Hartlepool?
Some of the train stations available in or near Hartlepool are Hartlepool, Seaton Carew and Billingham.
Property Price Paid in Hartlepool by Year
The average sold property price by year was:
| Year | Average Sold Price | Price Change |
Sold Properties
|
|---|---|---|---|
| 2024 | £104,054 | -19% |
119 Properties |
| 2023 | £124,309 | -6% |
1,307 Properties |
| 2022 | £132,066 | 3% |
1,717 Properties |
| 2021 | £128,702 | 3% |
2,023 Properties |
| 2020 | £125,402 | 2% |
1,488 Properties |
| 2019 | £123,254 | -6% |
1,497 Properties |
| 2018 | £130,339 | 4% |
1,495 Properties |
| 2017 | £124,533 | 5% |
1,446 Properties |
| 2016 | £118,210 | 1% |
1,415 Properties |
| 2015 | £117,486 | 1% |
1,453 Properties |
| 2014 | £115,818 | -3% |
1,329 Properties |
| 2013 | £119,481 | 1% |
1,000 Properties |
| 2012 | £118,561 | 0,2% |
878 Properties |
| 2011 | £118,360 | -2% |
866 Properties |
| 2010 | £121,146 | 5% |
868 Properties |
| 2009 | £115,668 | -5% |
787 Properties |
| 2008 | £121,424 | -1% |
1,099 Properties |
| 2007 | £122,793 | 10% |
2,128 Properties |
| 2006 | £110,664 | 13% |
2,272 Properties |
| 2005 | £96,622 | 16% |
1,933 Properties |
| 2004 | £80,942 | 10% |
2,595 Properties |
| 2003 | £73,093 | 16% |
2,502 Properties |
| 2002 | £61,101 | 8% |
2,290 Properties |
| 2001 | £56,369 | 3% |
2,152 Properties |
| 2000 | £54,490 | -1% |
1,751 Properties |
| 1999 | £54,996 | 9% |
1,477 Properties |
| 1998 | £49,851 | 5% |
1,413 Properties |
| 1997 | £47,199 | 4% |
1,306 Properties |
| 1996 | £45,458 | 7% |
1,272 Properties |
| 1995 | £42,221 | - |
1,176 Properties |
Property Price per Property Type in Hartlepool
Here you can find historic sold price data in order to help with your property search.
The average Property Paid Price for specific property types in the last three years are:
| Property Type | Average Sold Price | Sold Properties |
|---|---|---|
| Terraced House | £75,696.00 | 2,547 Terraced Houses |
| Flat | £86,686.00 | 258 Flats |
| Semi Detached House | £143,107.00 | 1,427 Semi Detached Houses |
| Detached House | £259,744.00 | 934 Detached Houses |