
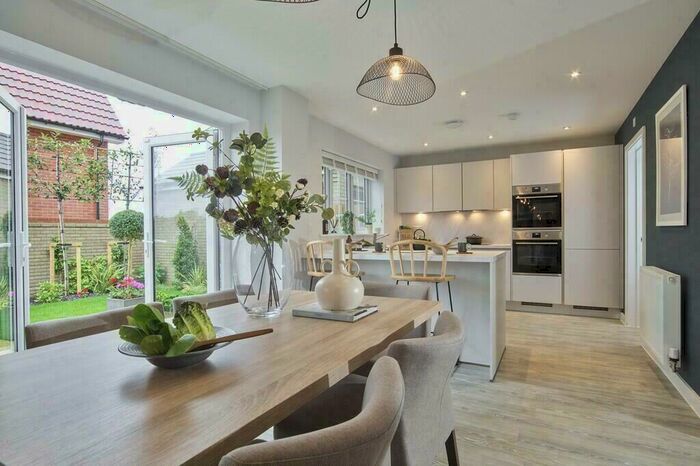
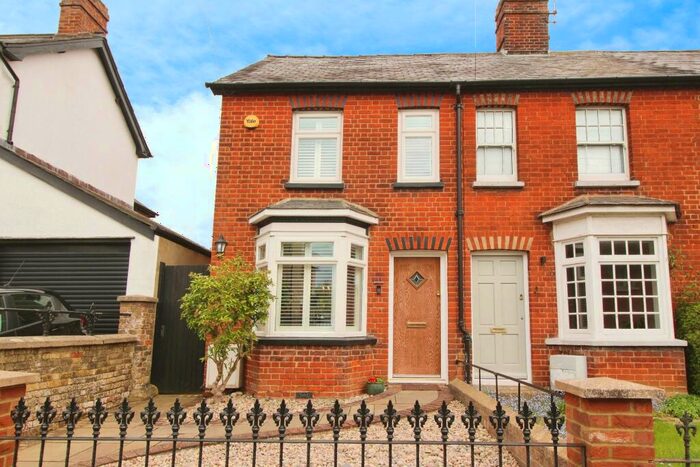
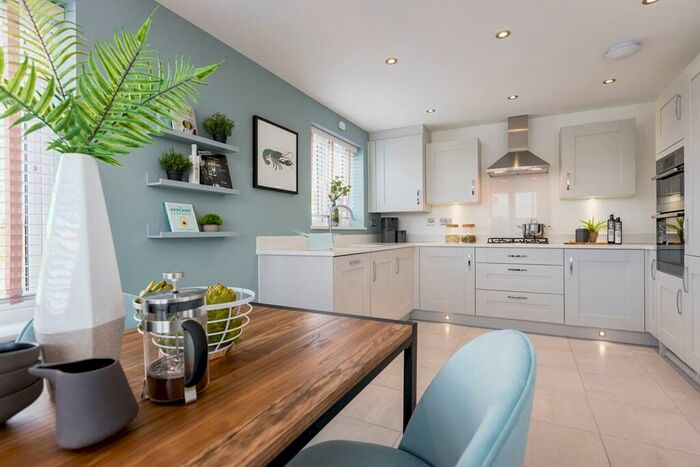
Houses for sale & to rent in Bishops Stortford, Hertfordshire
House Prices in Bishops Stortford
Properties in Bishops Stortford have an average house price of £481,853.00 and had 2,037 Property Transactions within the last 3 years.¹
Bishops Stortford is an area in Hertfordshire with 15,220 households², where the most expensive property was sold for £3,200,000.00.
Properties for sale in Bishops Stortford


Neighbourhoods in Bishops Stortford
Navigate through our locations to find the location of your next house in Bishops Stortford, Hertfordshire for sale or to rent.
Transport in Bishops Stortford
Please see below transportation links in this area:
-
 Bishops Stortford Station
 -
Stansted Mountfitchet Station
-
Sawbridgeworth Station
-
Stansted Airport Station
-
Elsenham Station
- FAQ
- Price Paid By Year
- Property Type Price
Frequently asked questions about Bishops Stortford
What is the average price for a property for sale in Bishops Stortford?
The average price for a property for sale in Bishops Stortford is £481,853. This amount is 8% lower than the average price in Hertfordshire. There are 4,051 property listings for sale in Bishops Stortford.
What locations have the most expensive properties for sale in Bishops Stortford?
The locations with the most expensive properties for sale in Bishops Stortford are Sawbridgeworth at an average of £726,500, Bishops Stortford Silverleys at an average of £554,439 and Bishops Stortford All Saints at an average of £536,050.
What locations have the most affordable properties for sale in Bishops Stortford?
The locations with the most affordable properties for sale in Bishops Stortford are Bishops Stortford Central at an average of £382,699, Bishops Stortford Meads at an average of £480,724 and Bishops Stortford South at an average of £487,387.
Which train stations are available in or near Bishops Stortford?
Some of the train stations available in or near Bishops Stortford are Bishops Stortford, Stansted Mountfitchet and Sawbridgeworth.
Property Price Paid in Bishops Stortford by Year
The average sold property price by year was:
| Year | Average Sold Price | Price Change |
Sold Properties
|
|---|---|---|---|
| 2024 | £418,517 | -16% |
28 Properties |
| 2023 | £486,907 | -1% |
446 Properties |
| 2022 | £491,450 | 4% |
712 Properties |
| 2021 | £473,258 | 5% |
851 Properties |
| 2020 | £448,032 | 0,4% |
718 Properties |
| 2019 | £446,257 | 2% |
774 Properties |
| 2018 | £438,229 | 5% |
778 Properties |
| 2017 | £417,965 | 7% |
644 Properties |
| 2016 | £389,188 | 7% |
694 Properties |
| 2015 | £360,715 | 9% |
824 Properties |
| 2014 | £328,855 | 14% |
752 Properties |
| 2013 | £284,031 | -4% |
719 Properties |
| 2012 | £294,610 | -1% |
592 Properties |
| 2011 | £296,627 | 0,3% |
549 Properties |
| 2010 | £295,834 | 17% |
596 Properties |
| 2009 | £246,447 | -14% |
644 Properties |
| 2008 | £280,536 | -4% |
507 Properties |
| 2007 | £292,295 | 8% |
974 Properties |
| 2006 | £269,793 | 5% |
1,240 Properties |
| 2005 | £255,174 | 3% |
1,010 Properties |
| 2004 | £247,222 | 11% |
986 Properties |
| 2003 | £220,365 | 13% |
984 Properties |
| 2002 | £191,657 | 10% |
1,065 Properties |
| 2001 | £173,149 | 7% |
1,155 Properties |
| 2000 | £160,419 | 17% |
1,019 Properties |
| 1999 | £133,765 | 15% |
1,290 Properties |
| 1998 | £113,069 | 10% |
1,156 Properties |
| 1997 | £101,419 | 7% |
1,463 Properties |
| 1996 | £94,573 | 6% |
1,288 Properties |
| 1995 | £89,201 | - |
878 Properties |
Property Price per Property Type in Bishops Stortford
Here you can find historic sold price data in order to help with your property search.
The average Property Paid Price for specific property types in the last three years are:
| Property Type | Average Sold Price | Sold Properties |
|---|---|---|
| Terraced House | £372,681.00 | 495 Terraced Houses |
| Flat | £254,389.00 | 412 Flats |
| Semi Detached House | £474,223.00 | 530 Semi Detached Houses |
| Detached House | £734,851.00 | 600 Detached Houses |