
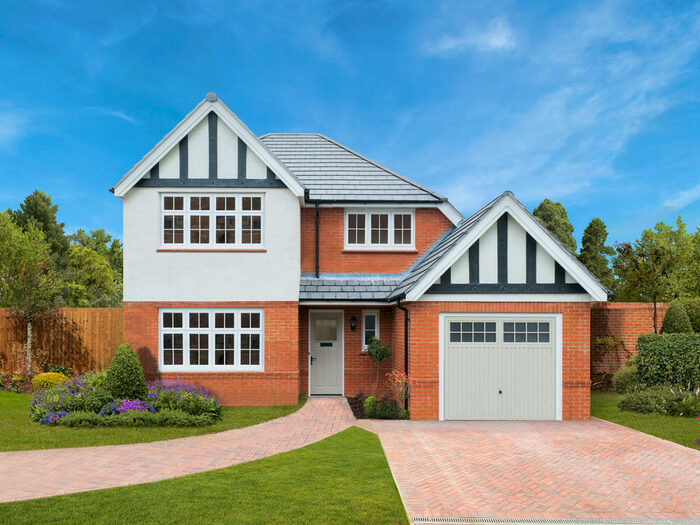
Houses for sale & to rent in Knebworth, Hertfordshire
House Prices in Knebworth
Properties in Knebworth have an average house price of £486,056.00 and had 328 Property Transactions within the last 3 years.¹
Knebworth is an area in Hertfordshire with 3,038 households², where the most expensive property was sold for £1,700,000.00.
Properties for sale in Knebworth


Neighbourhoods in Knebworth
Navigate through our locations to find the location of your next house in Knebworth, Hertfordshire for sale or to rent.
Transport in Knebworth
Please see below transportation links in this area:

- FAQ
- Price Paid By Year
- Property Type Price
Frequently asked questions about Knebworth
What is the average price for a property for sale in Knebworth?
The average price for a property for sale in Knebworth is £486,056. This amount is 7% lower than the average price in Hertfordshire. There are 4,888 property listings for sale in Knebworth.
What locations have the most expensive properties for sale in Knebworth?
The locations with the most expensive properties for sale in Knebworth are Datchworth And Aston at an average of £703,803 and Knebworth at an average of £487,023.
What locations have the most affordable properties for sale in Knebworth?
The location with the most affordable properties for sale in Knebworth is Welwyn East at an average of £391,695.
Which train stations are available in or near Knebworth?
Some of the train stations available in or near Knebworth are Knebworth, Welwyn North and Watton-At-Stone.
Property Price Paid in Knebworth by Year
The average sold property price by year was:
| Year | Average Sold Price | Price Change |
Sold Properties
|
|---|---|---|---|
| 2024 | £363,400 | -41% |
8 Properties |
| 2023 | £511,604 | 8% |
68 Properties |
| 2022 | £468,641 | -5% |
108 Properties |
| 2021 | £493,868 | 12% |
144 Properties |
| 2020 | £436,344 | -13% |
161 Properties |
| 2019 | £492,388 | 7% |
119 Properties |
| 2018 | £456,374 | -3% |
107 Properties |
| 2017 | £471,812 | 7% |
120 Properties |
| 2016 | £437,827 | 11% |
149 Properties |
| 2015 | £389,779 | -8% |
126 Properties |
| 2014 | £420,197 | 25% |
141 Properties |
| 2013 | £315,585 | -1% |
100 Properties |
| 2012 | £319,870 | 10% |
110 Properties |
| 2011 | £288,932 | -11% |
86 Properties |
| 2010 | £320,376 | 5% |
99 Properties |
| 2009 | £303,248 | -1% |
85 Properties |
| 2008 | £306,719 | -5% |
81 Properties |
| 2007 | £322,239 | 10% |
211 Properties |
| 2006 | £290,614 | 1% |
183 Properties |
| 2005 | £289,121 | 16% |
157 Properties |
| 2004 | £243,438 | 10% |
159 Properties |
| 2003 | £220,170 | -0,1% |
179 Properties |
| 2002 | £220,290 | 14% |
189 Properties |
| 2001 | £189,334 | 20% |
181 Properties |
| 2000 | £152,185 | 11% |
198 Properties |
| 1999 | £135,531 | 11% |
215 Properties |
| 1998 | £121,122 | 13% |
207 Properties |
| 1997 | £105,970 | -1% |
243 Properties |
| 1996 | £107,191 | 11% |
185 Properties |
| 1995 | £95,641 | - |
137 Properties |
Property Price per Property Type in Knebworth
Here you can find historic sold price data in order to help with your property search.
The average Property Paid Price for specific property types in the last three years are:
| Property Type | Average Sold Price | Sold Properties |
|---|---|---|
| Flat | £289,214.00 | 93 Flats |
| Semi Detached House | £523,211.00 | 73 Semi Detached Houses |
| Terraced House | £382,044.00 | 85 Terraced Houses |
| Detached House | £803,395.00 | 77 Detached Houses |