
Houses for sale & to rent in Potters Bar, Hertfordshire
House Prices in Potters Bar
Properties in Potters Bar have an average house price of £618,707.00 and had 1,299 Property Transactions within the last 3 years.¹
Potters Bar is an area in Hertfordshire with 11,884 households², where the most expensive property was sold for £5,200,000.00.
Properties for sale in Potters Bar


Neighbourhoods in Potters Bar
Navigate through our locations to find the location of your next house in Potters Bar, Hertfordshire for sale or to rent.
Transport in Potters Bar
Please see below transportation links in this area:
-
 Potters Bar Station
 -
Brookman's Park Station
-
Hadley Wood Station
-
Welham Green Station
-
Cuffley Station
- FAQ
- Price Paid By Year
- Property Type Price
Frequently asked questions about Potters Bar
What is the average price for a property for sale in Potters Bar?
The average price for a property for sale in Potters Bar is £618,707. This amount is 17% higher than the average price in Hertfordshire. There are more than 10,000 property listings for sale in Potters Bar.
What locations have the most expensive properties for sale in Potters Bar?
The locations with the most expensive properties for sale in Potters Bar are Northaw And Cuffley at an average of £861,131, Potters Bar Parkfield at an average of £589,237 and Brookmans Park And Little Heath at an average of £577,302.
What locations have the most affordable properties for sale in Potters Bar?
The locations with the most affordable properties for sale in Potters Bar are Shenley at an average of £474,666, Potters Bar Oakmere at an average of £517,565 and Potters Bar Furzefield at an average of £565,207.
Which train stations are available in or near Potters Bar?
Some of the train stations available in or near Potters Bar are Potters Bar, Brookman's Park and Hadley Wood.
Property Price Paid in Potters Bar by Year
The average sold property price by year was:
| Year | Average Sold Price | Price Change |
Sold Properties
|
|---|---|---|---|
| 2024 | £668,242 | 8% |
21 Properties |
| 2023 | £613,724 | 1% |
274 Properties |
| 2022 | £608,739 | -3% |
417 Properties |
| 2021 | £626,342 | 8% |
587 Properties |
| 2020 | £574,520 | 4% |
412 Properties |
| 2019 | £552,715 | -3% |
373 Properties |
| 2018 | £569,084 | 3% |
371 Properties |
| 2017 | £553,427 | 7% |
421 Properties |
| 2016 | £516,085 | 10% |
501 Properties |
| 2015 | £463,161 | 5% |
545 Properties |
| 2014 | £437,838 | 12% |
598 Properties |
| 2013 | £383,561 | 4% |
437 Properties |
| 2012 | £368,472 | -3% |
396 Properties |
| 2011 | £377,701 | 3% |
324 Properties |
| 2010 | £367,351 | 4% |
400 Properties |
| 2009 | £352,357 | -3% |
336 Properties |
| 2008 | £361,198 | 3% |
305 Properties |
| 2007 | £351,985 | 4% |
670 Properties |
| 2006 | £336,754 | 10% |
651 Properties |
| 2005 | £303,691 | 6% |
473 Properties |
| 2004 | £286,802 | 4% |
606 Properties |
| 2003 | £275,585 | 10% |
545 Properties |
| 2002 | £248,581 | 15% |
703 Properties |
| 2001 | £211,235 | 7% |
625 Properties |
| 2000 | £196,922 | 15% |
623 Properties |
| 1999 | £168,085 | 17% |
676 Properties |
| 1998 | £139,364 | 8% |
565 Properties |
| 1997 | £128,534 | 9% |
565 Properties |
| 1996 | £116,350 | 15% |
599 Properties |
| 1995 | £99,373 | - |
443 Properties |
Property Price per Property Type in Potters Bar
Here you can find historic sold price data in order to help with your property search.
The average Property Paid Price for specific property types in the last three years are:
| Property Type | Average Sold Price | Sold Properties |
|---|---|---|
| Semi Detached House | £600,985.00 | 516 Semi Detached Houses |
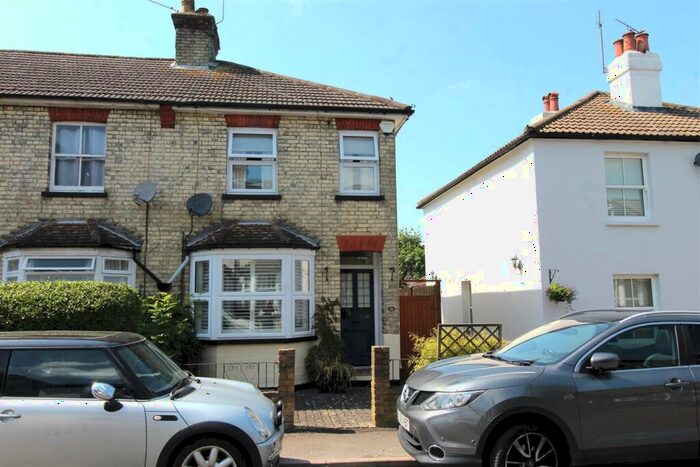
| Terraced House | £481,502.00 | 168 Terraced Houses |
| Detached House | £959,888.00 | 347 Detached Houses |
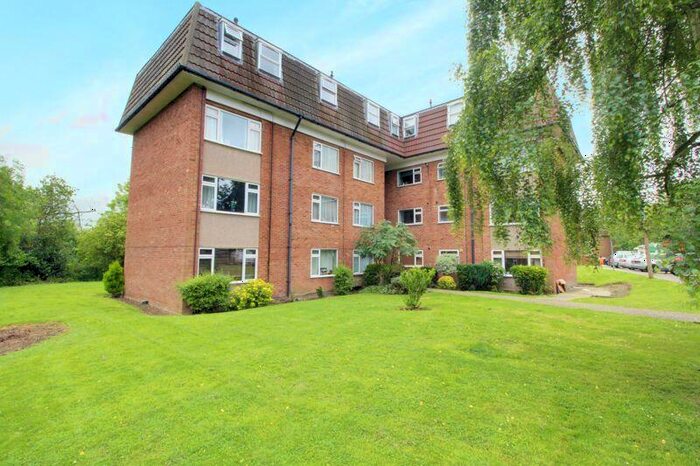
| Flat | £297,086.00 | 268 Flats |