
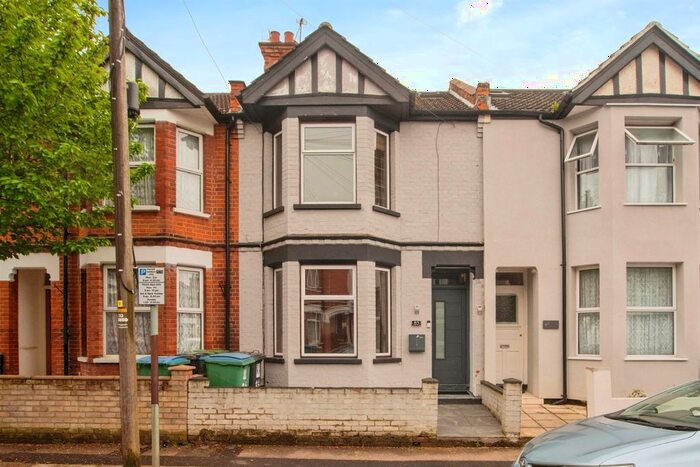
Houses for sale & to rent in Watford, Hertfordshire
House Prices in Watford
Properties in Watford have an average house price of £441,672.00 and had 5,079 Property Transactions within the last 3 years.¹
Watford is an area in Hertfordshire with 47,567 households², where the most expensive property was sold for £4,500,000.00.
Properties for sale in Watford


Neighbourhoods in Watford
Navigate through our locations to find the location of your next house in Watford, Hertfordshire for sale or to rent.
- Aldenham West
- Bushey Heath
- Bushey North
- Bushey St James
- Callowland
- Carpenders Park
- Central
- Dickinsons
- Holywell
- Leavesden
- Leggatts
- Meriden
- Moor Park And Eastbury
- Nascot
- Oxhey
- Oxhey Hall And Hayling
- Park
- South Oxhey
- St Stephen
- Stanborough
- Tudor
- Vicarage
- Woodside
- Moor Park & Eastbury
- Oxhey Hall & Hayling
Transport in Watford
Please see below transportation links in this area:
-

 Watford Junction Station
 -
Watford High Street Station
-
 Watford Station
 -
Bushey Station
-
Watford North Station
-
Garston (Hertfordshire) Station
-
Croxley Station
-
Carpenders Park Station
-
Moor Park Station
- FAQ
- Price Paid By Year
- Property Type Price
Frequently asked questions about Watford
What is the average price for a property for sale in Watford?
The average price for a property for sale in Watford is £441,672. This amount is 17% lower than the average price in Hertfordshire. There are more than 10,000 property listings for sale in Watford.
What locations have the most expensive properties for sale in Watford?
The locations with the most expensive properties for sale in Watford are Bushey North at an average of £929,545, Bushey St James at an average of £704,400 and Park at an average of £674,639.
What locations have the most affordable properties for sale in Watford?
The locations with the most affordable properties for sale in Watford are Central at an average of £337,448, Holywell at an average of £347,731 and Callowland at an average of £360,679.
Which train stations are available in or near Watford?
Some of the train stations available in or near Watford are Watford Junction, Watford High Street and Bushey.
Which tube stations are available in or near Watford?
Some of the tube stations available in or near Watford are Watford, Croxley and Moor Park.
Property Price Paid in Watford by Year
The average sold property price by year was:
| Year | Average Sold Price | Price Change |
Sold Properties
|
|---|---|---|---|
| 2024 | £437,466 | -3% |
68 Properties |
| 2023 | £450,872 | 0,2% |
1,051 Properties |
| 2022 | £449,872 | 4% |
1,701 Properties |
| 2021 | £431,344 | 2% |
2,259 Properties |
| 2020 | £422,384 | 3% |
1,421 Properties |
| 2019 | £410,943 | -3% |
1,642 Properties |
| 2018 | £421,300 | 4% |
1,700 Properties |
| 2017 | £404,205 | 4% |
1,778 Properties |
| 2016 | £389,936 | 12% |
1,920 Properties |
| 2015 | £345,036 | 12% |
2,179 Properties |
| 2014 | £305,027 | 7% |
2,361 Properties |
| 2013 | £283,076 | 5% |
1,962 Properties |
| 2012 | £267,729 | 5% |
1,745 Properties |
| 2011 | £255,232 | 1% |
1,656 Properties |
| 2010 | £251,798 | 3% |
1,685 Properties |
| 2009 | £243,304 | -1% |
1,501 Properties |
| 2008 | £246,908 | -4% |
1,504 Properties |
| 2007 | £257,934 | 8% |
2,885 Properties |
| 2006 | £236,697 | 5% |
2,973 Properties |
| 2005 | £224,383 | 8% |
2,412 Properties |
| 2004 | £207,178 | 8% |
2,984 Properties |
| 2003 | £191,327 | 14% |
2,745 Properties |
| 2002 | £165,486 | 12% |
3,001 Properties |
| 2001 | £145,825 | 14% |
3,012 Properties |
| 2000 | £125,910 | 11% |
2,463 Properties |
| 1999 | £112,460 | 11% |
3,053 Properties |
| 1998 | £99,550 | 17% |
2,709 Properties |
| 1997 | £82,439 | 11% |
2,833 Properties |
| 1996 | £73,780 | 4% |
2,538 Properties |
| 1995 | £70,806 | - |
1,925 Properties |
Property Price per Property Type in Watford
Here you can find historic sold price data in order to help with your property search.
The average Property Paid Price for specific property types in the last three years are:
| Property Type | Average Sold Price | Sold Properties |
|---|---|---|
| Terraced House | £421,413.00 | 1,675 Terraced Houses |
| Flat | £276,618.00 | 1,658 Flats |
| Semi Detached House | £534,662.00 | 1,261 Semi Detached Houses |
| Detached House | £834,110.00 | 485 Detached Houses |