
Houses for sale & to rent in Derby, Leicestershire
House Prices in Derby
Properties in Derby have an average house price of £293,338.00 and had 732 Property Transactions within the last 3 years.¹
Derby is an area in Leicestershire with 5,241 households², where the most expensive property was sold for £1,750,000.00.
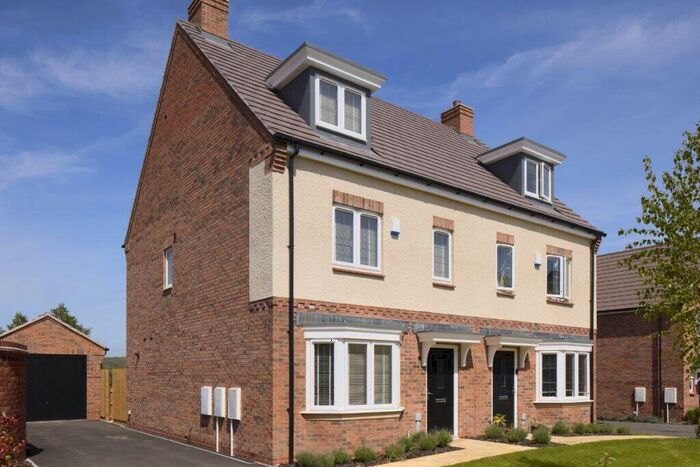
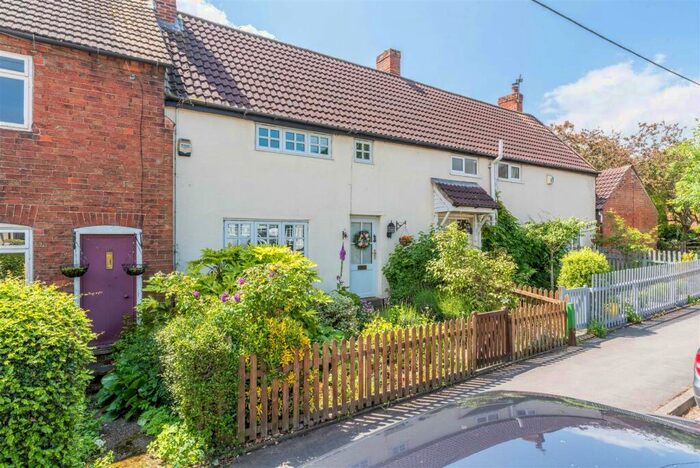
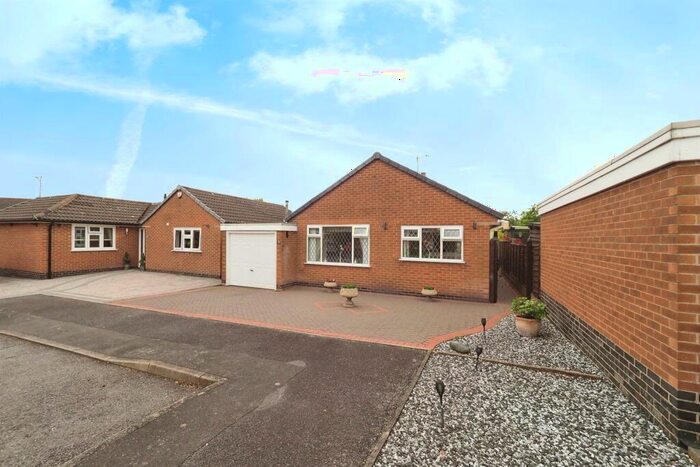
Properties for sale in Derby


Neighbourhoods in Derby
Navigate through our locations to find the location of your next house in Derby, Leicestershire for sale or to rent.
Transport in Derby
Please see below transportation links in this area:
-
 East Midlands Parkway Station
 -
Long Eaton Station
-
Spondon Station
-
Attenborough Station
-
Loughborough Station
-
Peartree Station
-
Derby Station
-
Beeston Station
-
Willington Station
-
Barrow-Upon-Soar Station
- FAQ
- Price Paid By Year
- Property Type Price
Frequently asked questions about Derby
What is the average price for a property for sale in Derby?
The average price for a property for sale in Derby is £293,338. This amount is 0.16% lower than the average price in Leicestershire. There are 6,535 property listings for sale in Derby.
What locations have the most expensive properties for sale in Derby?
The locations with the most expensive properties for sale in Derby are Worthington & Breedon at an average of £463,071, Breedon at an average of £378,552 and Daleacre Hill at an average of £292,500.
What locations have the most affordable properties for sale in Derby?
The locations with the most affordable properties for sale in Derby are Kegworth at an average of £98,000, Castle Donington Castle at an average of £242,487 and Kegworth And Whatton at an average of £273,408.
Which train stations are available in or near Derby?
Some of the train stations available in or near Derby are East Midlands Parkway, Long Eaton and Spondon.
Property Price Paid in Derby by Year
The average sold property price by year was:
| Year | Average Sold Price | Price Change |
Sold Properties
|
|---|---|---|---|
| 2024 | £278,464 | -7% |
14 Properties |
| 2023 | £298,536 | 0,2% |
145 Properties |
| 2022 | £297,834 | 3% |
231 Properties |
| 2021 | £288,706 | 12% |
342 Properties |
| 2020 | £253,469 | 4% |
271 Properties |
| 2019 | £243,743 | 1% |
295 Properties |
| 2018 | £242,392 | 3% |
249 Properties |
| 2017 | £235,954 | 3% |
251 Properties |
| 2016 | £228,828 | 4% |
306 Properties |
| 2015 | £219,289 | 7% |
304 Properties |
| 2014 | £204,787 | -6% |
338 Properties |
| 2013 | £217,391 | 12% |
274 Properties |
| 2012 | £190,258 | 6% |
161 Properties |
| 2011 | £177,969 | -2% |
150 Properties |
| 2010 | £181,527 | 4% |
126 Properties |
| 2009 | £174,653 | -6% |
144 Properties |
| 2008 | £185,214 | -10% |
142 Properties |
| 2007 | £204,233 | 12% |
277 Properties |
| 2006 | £179,327 | 2% |
361 Properties |
| 2005 | £175,063 | 0,1% |
268 Properties |
| 2004 | £174,813 | 11% |
314 Properties |
| 2003 | £155,441 | 22% |
266 Properties |
| 2002 | £121,251 | 18% |
259 Properties |
| 2001 | £99,321 | 11% |
249 Properties |
| 2000 | £88,729 | 3% |
243 Properties |
| 1999 | £85,847 | 9% |
248 Properties |
| 1998 | £78,154 | 9% |
259 Properties |
| 1997 | £71,384 | 11% |
248 Properties |
| 1996 | £63,880 | -13% |
182 Properties |
| 1995 | £72,216 | - |
190 Properties |
Property Price per Property Type in Derby
Here you can find historic sold price data in order to help with your property search.
The average Property Paid Price for specific property types in the last three years are:
| Property Type | Average Sold Price | Sold Properties |
|---|---|---|
| Semi Detached House | £248,367.00 | 202 Semi Detached Houses |
| Terraced House | £208,236.00 | 153 Terraced Houses |
| Detached House | £374,672.00 | 343 Detached Houses |
| Flat | £122,956.00 | 34 Flats |