
Houses for sale & to rent in Peterborough, Lincolnshire
House Prices in Peterborough
Properties in Peterborough have an average house price of £289,543.00 and had 1,196 Property Transactions within the last 3 years.¹
Peterborough is an area in Lincolnshire with 8,829 households², where the most expensive property was sold for £1,300,000.00.
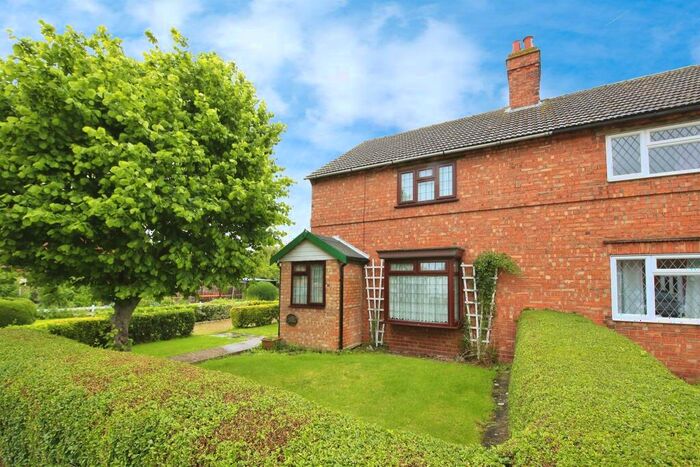
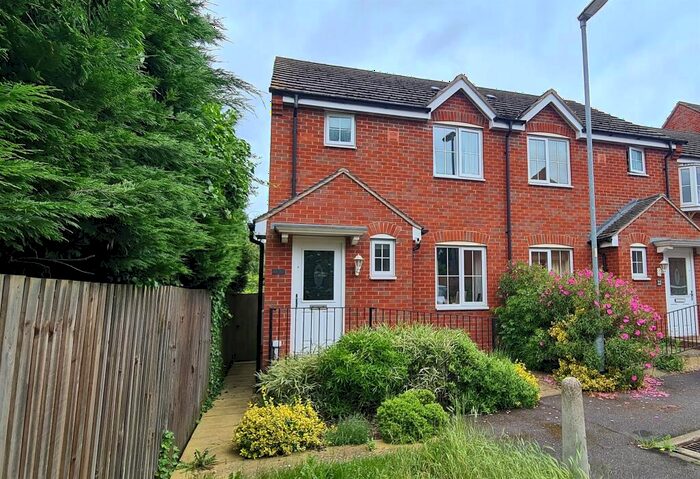
Properties for sale in Peterborough


Neighbourhoods in Peterborough
Navigate through our locations to find the location of your next house in Peterborough, Lincolnshire for sale or to rent.
Transport in Peterborough
Please see below transportation links in this area:

- FAQ
- Price Paid By Year
- Property Type Price
Frequently asked questions about Peterborough
What is the average price for a property for sale in Peterborough?
The average price for a property for sale in Peterborough is £289,543. This amount is 18% higher than the average price in Lincolnshire. There are more than 10,000 property listings for sale in Peterborough.
What locations have the most expensive properties for sale in Peterborough?
The locations with the most expensive properties for sale in Peterborough are Moulton, Weston And Cowbit at an average of £567,500, Truesdale at an average of £362,242 and Casewick at an average of £330,681.
What locations have the most affordable properties for sale in Peterborough?
The locations with the most affordable properties for sale in Peterborough are Whaplode And Holbeach St Johns at an average of £225,415, Crowland And Deeping St Nicholas at an average of £264,002 and Deeping St James at an average of £265,256.
Which train stations are available in or near Peterborough?
Some of the train stations available in or near Peterborough are Peterborough, Stamford and Spalding.
Property Price Paid in Peterborough by Year
The average sold property price by year was:
| Year | Average Sold Price | Price Change |
Sold Properties
|
|---|---|---|---|
| 2024 | £253,375 | -22% |
12 Properties |
| 2023 | £307,955 | 4% |
261 Properties |
| 2022 | £296,992 | 7% |
360 Properties |
| 2021 | £277,015 | 6% |
563 Properties |
| 2020 | £261,582 | 2% |
383 Properties |
| 2019 | £256,248 | 7% |
405 Properties |
| 2018 | £238,910 | -1% |
453 Properties |
| 2017 | £242,384 | 6% |
445 Properties |
| 2016 | £227,296 | 6% |
497 Properties |
| 2015 | £213,203 | 3% |
504 Properties |
| 2014 | £205,867 | 10% |
433 Properties |
| 2013 | £185,202 | 3% |
370 Properties |
| 2012 | £180,063 | -3% |
334 Properties |
| 2011 | £185,166 | -2% |
294 Properties |
| 2010 | £188,222 | 13% |
277 Properties |
| 2009 | £163,389 | -19% |
244 Properties |
| 2008 | £193,945 | 2% |
237 Properties |
| 2007 | £189,746 | 5% |
477 Properties |
| 2006 | £180,485 | 5% |
606 Properties |
| 2005 | £171,495 | 5% |
469 Properties |
| 2004 | £163,125 | 11% |
535 Properties |
| 2003 | £144,635 | 13% |
618 Properties |
| 2002 | £126,244 | 17% |
621 Properties |
| 2001 | £104,523 | 14% |
683 Properties |
| 2000 | £89,633 | 15% |
522 Properties |
| 1999 | £75,963 | 3% |
579 Properties |
| 1998 | £73,469 | 7% |
585 Properties |
| 1997 | £67,959 | 9% |
693 Properties |
| 1996 | £62,076 | -2% |
623 Properties |
| 1995 | £63,514 | - |
488 Properties |
Property Price per Property Type in Peterborough
Here you can find historic sold price data in order to help with your property search.
The average Property Paid Price for specific property types in the last three years are:
| Property Type | Average Sold Price | Sold Properties |
|---|---|---|
| Semi Detached House | £230,722.00 | 343 Semi Detached Houses |
| Detached House | £361,329.00 | 613 Detached Houses |
| Flat | £142,988.00 | 27 Flats |
| Terraced House | £196,243.00 | 213 Terraced Houses |