
Houses for sale & to rent in Middlesbrough, Middlesbrough
House Prices in Middlesbrough
Properties in Middlesbrough have an average house price of £134,800.00 and had 6,930 Property Transactions within the last 3 years.¹
Middlesbrough is an area in Middlesbrough with 57,052 households², where the most expensive property was sold for £1,790,000.00.
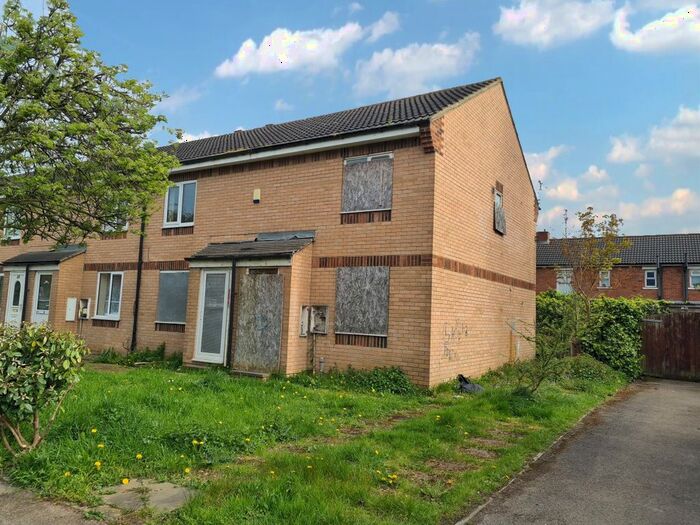
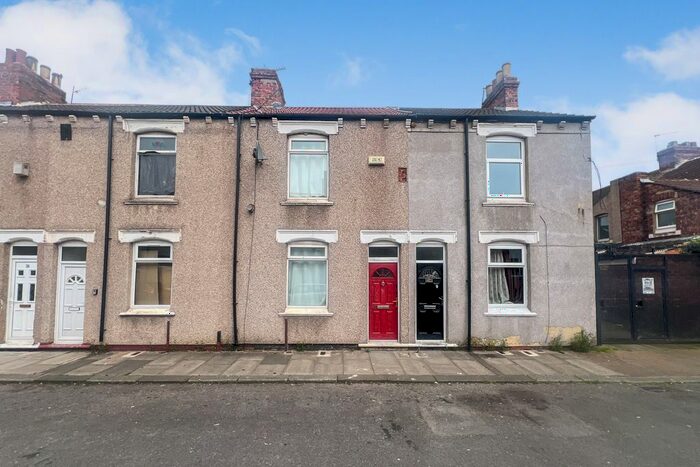
Properties for sale in Middlesbrough


Neighbourhoods in Middlesbrough
Navigate through our locations to find the location of your next house in Middlesbrough, Middlesbrough for sale or to rent.
- Acklam
- Ayresome
- Beckfield
- Beechwood
- Brookfield
- Clairville
- Coulby Newham
- Gresham
- Hemlington
- Kader
- Ladgate
- Linthorpe
- Marton
- Marton West
- Middlehaven
- North Ormesby And Brambles Farm
- Nunthorpe
- Pallister
- Park
- Park End
- Stainton And Thornton
- Thorntree
- University
- North Ormesby
- Park End & Beckfield
- Brambles & Thorntree
- Berwick Hills & Pallister
- Longlands & Beechwood
- Marton East
- Trimdon
- Stainton & Thornton
- Newport
- Central
Transport in Middlesbrough
Please see below transportation links in this area:
-
 James Cook University Hospital Station
 -
Marton Station
-
Middlesbrough Station
-
Gypsy Lane Station
-
Nunthorpe Station
-
South Bank Station
- FAQ
- Price Paid By Year
- Property Type Price
Frequently asked questions about Middlesbrough
What is the average price for a property for sale in Middlesbrough?
The average price for a property for sale in Middlesbrough is £134,800. This amount is 0.04% lower than the average price in Middlesbrough. There are 8,120 property listings for sale in Middlesbrough.
What locations have the most expensive properties for sale in Middlesbrough?
The locations with the most expensive properties for sale in Middlesbrough are Nunthorpe at an average of £309,192, Trimdon at an average of £257,327 and Marton East at an average of £255,215.
What locations have the most affordable properties for sale in Middlesbrough?
The locations with the most affordable properties for sale in Middlesbrough are North Ormesby And Brambles Farm at an average of £56,984, North Ormesby at an average of £58,749 and Gresham at an average of £65,041.
Which train stations are available in or near Middlesbrough?
Some of the train stations available in or near Middlesbrough are James Cook University Hospital, Marton and Middlesbrough.
Property Price Paid in Middlesbrough by Year
The average sold property price by year was:
| Year | Average Sold Price | Price Change |
Sold Properties
|
|---|---|---|---|
| 2024 | £118,931 | -11% |
141 Properties |
| 2023 | £132,236 | -2% |
1,719 Properties |
| 2022 | £134,795 | -2% |
2,310 Properties |
| 2021 | £137,210 | 3% |
2,760 Properties |
| 2020 | £133,612 | -2% |
1,989 Properties |
| 2019 | £136,634 | 1% |
2,392 Properties |
| 2018 | £135,333 | 1% |
2,258 Properties |
| 2017 | £134,316 | -4% |
2,135 Properties |
| 2016 | £139,361 | 2% |
2,107 Properties |
| 2015 | £136,185 | 5% |
2,114 Properties |
| 2014 | £129,195 | 11% |
1,884 Properties |
| 2013 | £115,105 | -4% |
1,387 Properties |
| 2012 | £119,714 | 6% |
1,200 Properties |
| 2011 | £112,795 | -2% |
1,371 Properties |
| 2010 | £114,797 | -4% |
1,245 Properties |
| 2009 | £119,127 | 4% |
1,157 Properties |
| 2008 | £114,333 | -5% |
1,612 Properties |
| 2007 | £119,735 | 3% |
3,342 Properties |
| 2006 | £116,414 | 11% |
3,271 Properties |
| 2005 | £103,141 | 14% |
2,850 Properties |
| 2004 | £89,117 | 22% |
3,087 Properties |
| 2003 | £69,478 | 15% |
3,074 Properties |
| 2002 | £58,976 | 11% |
2,917 Properties |
| 2001 | £52,582 | 4% |
2,530 Properties |
| 2000 | £50,725 | 3% |
2,249 Properties |
| 1999 | £49,453 | 4% |
2,140 Properties |
| 1998 | £47,502 | -3% |
1,940 Properties |
| 1997 | £49,025 | 4% |
1,921 Properties |
| 1996 | £47,158 | 5% |
1,855 Properties |
| 1995 | £44,820 | - |
1,661 Properties |
Property Price per Property Type in Middlesbrough
Here you can find historic sold price data in order to help with your property search.
The average Property Paid Price for specific property types in the last three years are:
| Property Type | Average Sold Price | Sold Properties |
|---|---|---|
| Terraced House | £83,209.00 | 3,014 Terraced Houses |
| Flat | £77,167.00 | 328 Flats |
| Semi Detached House | £145,876.00 | 2,521 Semi Detached Houses |
| Detached House | £272,075.00 | 1,067 Detached Houses |