
Houses for sale & to rent in Kings Lynn, Norfolk
House Prices in Kings Lynn
Properties in Kings Lynn have an average house price of £299,673.00 and had 5,481 Property Transactions within the last 3 years.¹
Kings Lynn is an area in Norfolk with 46,331 households², where the most expensive property was sold for £3,825,000.00.
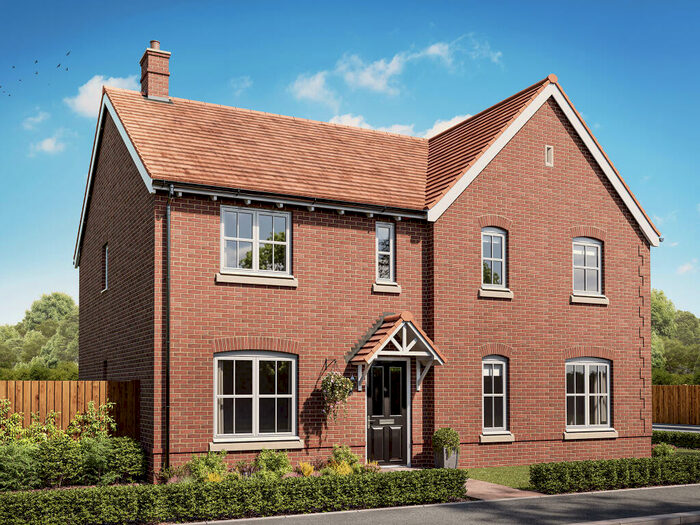
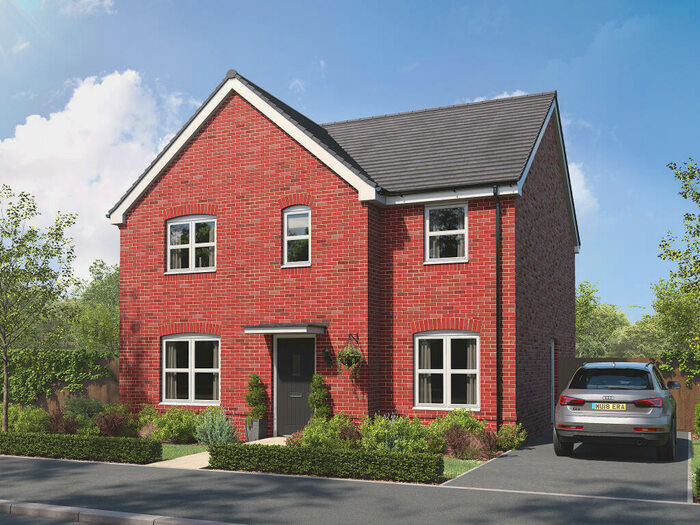
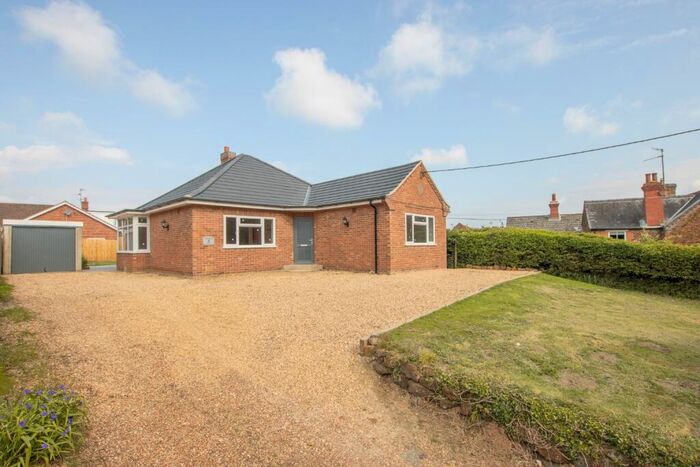
Properties for sale in Kings Lynn


Neighbourhoods in Kings Lynn
Navigate through our locations to find the location of your next house in Kings Lynn, Norfolk for sale or to rent.
- Airfield
- Brancaster
- Burnham
- Clenchwarton
- Denton
- Dersingham
- Docking
- Fairstead
- Gayton
- Gaywood Chase
- Gaywood North Bank
- Grimston
- Heacham
- Hermitage
- Hilgay With Denver
- Launditch
- Mid Forest
- Nar Valley
- North Lynn
- North Wootton
- Old Gaywood
- Priory
- Rudham
- Snettisham
- South And West Lynn
- South Wootton
- Spellowfields
- Springwood
- St Lawrence
- St Margarets With St Nicholas
- Taverner
- The Raynhams
- Upwell And Delph
- Valley Hill
- Walpole
- Watlington
- West Winch
- Wiggenhall
- Wimbotsham With Fincham
- Wissey
- The Woottons
- Gayton & Grimston
- South & West Lynn
- Gaywood Clock
- Massingham with Castle Acre
- Bircham with Rudhams
- Burnham Market & Docking
- Denver
- Bedingfeld
- Methwold
- Tilney, Mershe Lande & Wiggenhall
- Upwell & Delph
- Terrington
Transport in Kings Lynn
Please see below transportation links in this area:

- FAQ
- Price Paid By Year
- Property Type Price
Frequently asked questions about Kings Lynn
What is the average price for a property for sale in Kings Lynn?
The average price for a property for sale in Kings Lynn is £299,673. This amount is 0.67% lower than the average price in Norfolk. There are more than 10,000 property listings for sale in Kings Lynn.
What locations have the most expensive properties for sale in Kings Lynn?
The locations with the most expensive properties for sale in Kings Lynn are Burnham Market & Docking at an average of £1,051,688, Brancaster at an average of £823,671 and Burnham at an average of £810,186.
What locations have the most affordable properties for sale in Kings Lynn?
The locations with the most affordable properties for sale in Kings Lynn are North Lynn at an average of £143,543, St Margarets With St Nicholas at an average of £160,647 and Fairstead at an average of £163,399.
Which train stations are available in or near Kings Lynn?
Some of the train stations available in or near Kings Lynn are King's Lynn, Watlington and Downham Market.
Property Price Paid in Kings Lynn by Year
The average sold property price by year was:
| Year | Average Sold Price | Price Change |
Sold Properties
|
|---|---|---|---|
| 2024 | £337,097 | 11% |
98 Properties |
| 2023 | £300,625 | -5% |
1,170 Properties |
| 2022 | £315,234 | 9% |
1,735 Properties |
| 2021 | £286,849 | 4% |
2,478 Properties |
| 2020 | £276,485 | 9% |
1,720 Properties |
| 2019 | £252,033 | 5% |
1,932 Properties |
| 2018 | £240,039 | 0,1% |
1,895 Properties |
| 2017 | £239,770 | 5% |
2,036 Properties |
| 2016 | £227,919 | 10% |
2,058 Properties |
| 2015 | £205,443 | 3% |
2,000 Properties |
| 2014 | £200,060 | 5% |
2,077 Properties |
| 2013 | £189,469 | 8% |
1,737 Properties |
| 2012 | £174,585 | -7% |
1,426 Properties |
| 2011 | £186,706 | 2% |
1,438 Properties |
| 2010 | £183,489 | 6% |
1,392 Properties |
| 2009 | £172,720 | -3% |
1,383 Properties |
| 2008 | £177,651 | -3% |
1,295 Properties |
| 2007 | £183,678 | 7% |
2,648 Properties |
| 2006 | £170,339 | 3% |
2,439 Properties |
| 2005 | £165,065 | 7% |
1,941 Properties |
| 2004 | £154,230 | 15% |
2,348 Properties |
| 2003 | £131,527 | 17% |
2,154 Properties |
| 2002 | £109,641 | 16% |
2,617 Properties |
| 2001 | £91,619 | 18% |
2,495 Properties |
| 2000 | £74,775 | 9% |
2,459 Properties |
| 1999 | £68,127 | -4% |
2,572 Properties |
| 1998 | £71,097 | 18% |
2,243 Properties |
| 1997 | £57,958 | 8% |
2,328 Properties |
| 1996 | £53,085 | 4% |
2,129 Properties |
| 1995 | £51,090 | - |
1,681 Properties |
Property Price per Property Type in Kings Lynn
Here you can find historic sold price data in order to help with your property search.
The average Property Paid Price for specific property types in the last three years are:
| Property Type | Average Sold Price | Sold Properties |
|---|---|---|
| Terraced House | £214,276.00 | 1,275 Terraced Houses |
| Flat | £118,162.00 | 257 Flats |
| Semi Detached House | £252,482.00 | 1,571 Semi Detached Houses |
| Detached House | £396,254.00 | 2,378 Detached Houses |