
Houses for sale & to rent in Leyburn, North Yorkshire
House Prices in Leyburn
Properties in Leyburn have an average house price of £350,130.00 and had 470 Property Transactions within the last 3 years.¹
Leyburn is an area in North Yorkshire with 3,795 households², where the most expensive property was sold for £925,000.00.
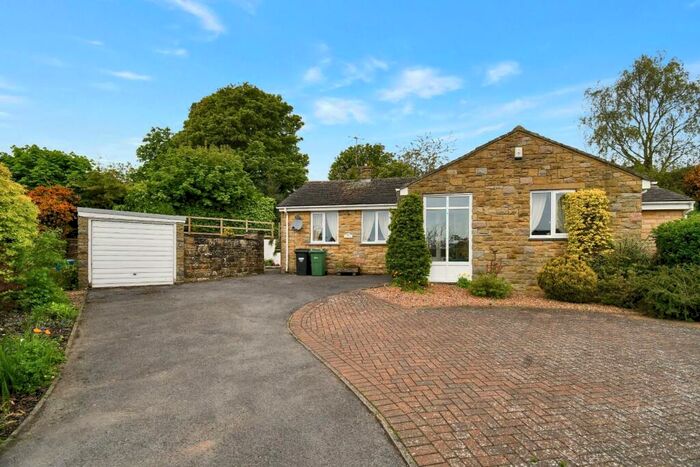
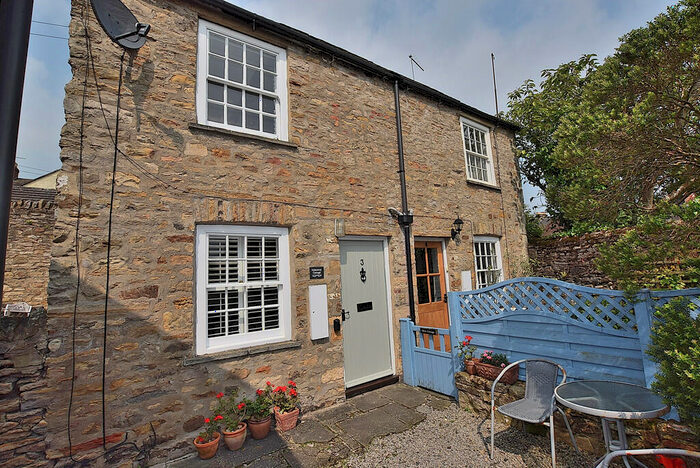
Properties for sale in Leyburn


Neighbourhoods in Leyburn
Navigate through our locations to find the location of your next house in Leyburn, North Yorkshire for sale or to rent.
Transport in Leyburn
Please see below transportation links in this area:

- FAQ
- Price Paid By Year
- Property Type Price
Frequently asked questions about Leyburn
What is the average price for a property for sale in Leyburn?
The average price for a property for sale in Leyburn is £350,130. This amount is 13% higher than the average price in North Yorkshire. There are 815 property listings for sale in Leyburn.
What locations have the most expensive properties for sale in Leyburn?
The locations with the most expensive properties for sale in Leyburn are Lower Wensleydale at an average of £425,610, Bolton Castle at an average of £391,029 and Penhill at an average of £376,161.
What locations have the most affordable properties for sale in Leyburn?
The locations with the most affordable properties for sale in Leyburn are Leyburn at an average of £307,703, Middleham at an average of £338,800 and Addlebrough at an average of £365,639.
Which train stations are available in or near Leyburn?
Some of the train stations available in or near Leyburn are Northallerton, Garsdale and Dent.
Property Price Paid in Leyburn by Year
The average sold property price by year was:
| Year | Average Sold Price | Price Change |
Sold Properties
|
|---|---|---|---|
| 2024 | £392,276 | 11% |
19 Properties |
| 2023 | £347,731 | -10% |
102 Properties |
| 2022 | £381,915 | 15% |
147 Properties |
| 2021 | £324,247 | 13% |
202 Properties |
| 2020 | £281,191 | -3% |
158 Properties |
| 2019 | £290,812 | 10% |
125 Properties |
| 2018 | £262,470 | -1% |
169 Properties |
| 2017 | £264,955 | 2% |
193 Properties |
| 2016 | £260,494 | -1% |
169 Properties |
| 2015 | £263,166 | 2% |
151 Properties |
| 2014 | £257,144 | 4% |
139 Properties |
| 2013 | £247,034 | -0,4% |
130 Properties |
| 2012 | £248,050 | 1% |
112 Properties |
| 2011 | £245,684 | -10% |
108 Properties |
| 2010 | £270,445 | 10% |
101 Properties |
| 2009 | £244,113 | -11% |
101 Properties |
| 2008 | £270,010 | -12% |
112 Properties |
| 2007 | £301,645 | 16% |
153 Properties |
| 2006 | £253,903 | 5% |
188 Properties |
| 2005 | £241,280 | 11% |
145 Properties |
| 2004 | £214,914 | 16% |
184 Properties |
| 2003 | £180,896 | 21% |
213 Properties |
| 2002 | £143,707 | 18% |
263 Properties |
| 2001 | £117,793 | 16% |
173 Properties |
| 2000 | £99,191 | -4% |
156 Properties |
| 1999 | £103,138 | 22% |
189 Properties |
| 1998 | £80,765 | -9% |
179 Properties |
| 1997 | £88,085 | 14% |
154 Properties |
| 1996 | £75,647 | -6% |
135 Properties |
| 1995 | £80,119 | - |
117 Properties |
Property Price per Property Type in Leyburn
Here you can find historic sold price data in order to help with your property search.
The average Property Paid Price for specific property types in the last three years are:
| Property Type | Average Sold Price | Sold Properties |
|---|---|---|
| Semi Detached House | £303,018.00 | 130 Semi Detached Houses |
| Terraced House | £269,245.00 | 122 Terraced Houses |
| Detached House | £431,337.00 | 209 Detached Houses |
| Flat | £241,282.00 | 9 Flats |