
Houses for sale & to rent in Tadcaster, North Yorkshire
House Prices in Tadcaster
Properties in Tadcaster have an average house price of £322,876.00 and had 539 Property Transactions within the last 3 years.¹
Tadcaster is an area in North Yorkshire with 4,907 households², where the most expensive property was sold for £1,200,000.00.
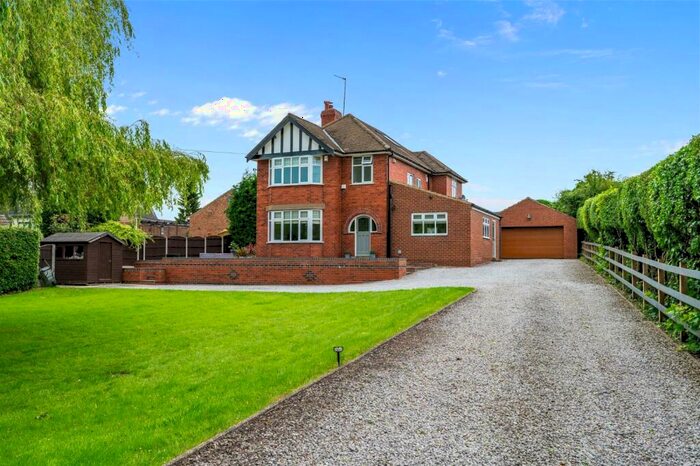
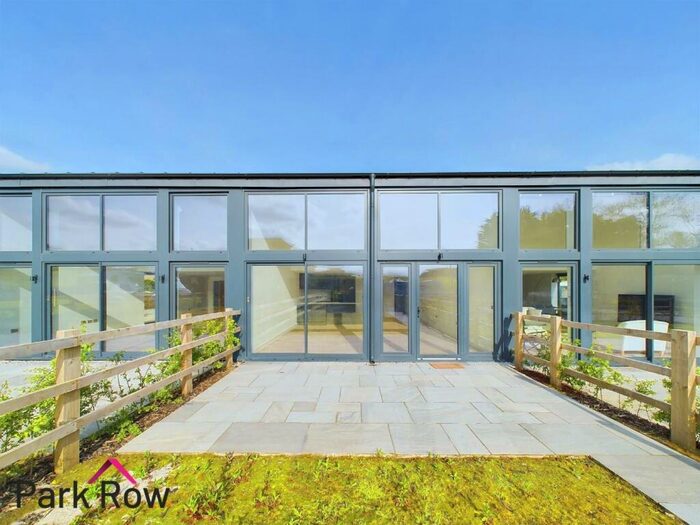
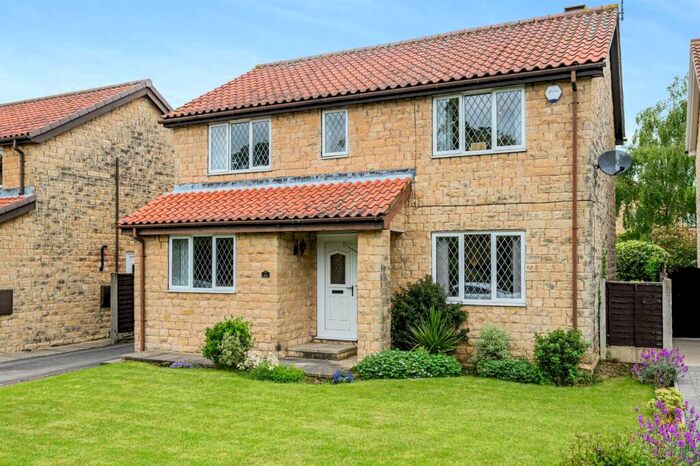
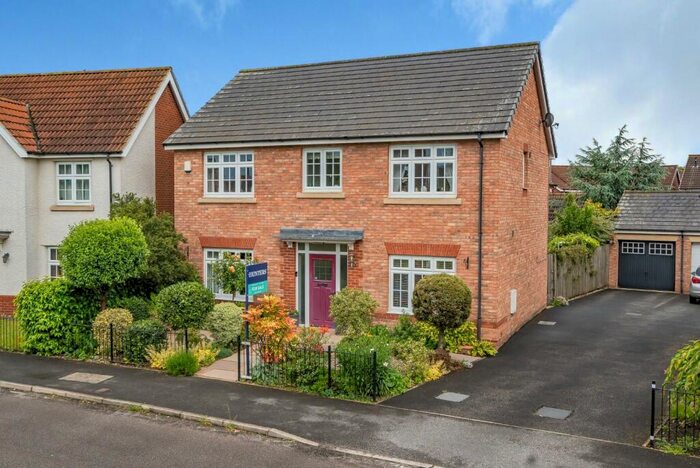
Properties for sale in Tadcaster


Neighbourhoods in Tadcaster
Navigate through our locations to find the location of your next house in Tadcaster, North Yorkshire for sale or to rent.
Transport in Tadcaster
Please see below transportation links in this area:
-
 Ulleskelf Station
 -
Church Fenton Station
-
Sherburn-In-Elmet Station
-
South Milford Station
-
Micklefield Station
-
East Garforth Station
-
Garforth Station
-
Poppleton Station
-
York Station
-
Hammerton Station
- FAQ
- Price Paid By Year
- Property Type Price
Frequently asked questions about Tadcaster
What is the average price for a property for sale in Tadcaster?
The average price for a property for sale in Tadcaster is £322,876. This amount is 5% higher than the average price in North Yorkshire. There are 3,279 property listings for sale in Tadcaster.
What locations have the most expensive properties for sale in Tadcaster?
The locations with the most expensive properties for sale in Tadcaster are Marston Moor at an average of £680,875, Appleton Roebuck at an average of £551,272 and Tadcaster at an average of £424,535.
What locations have the most affordable properties for sale in Tadcaster?
The locations with the most affordable properties for sale in Tadcaster are Tadcaster East at an average of £245,851, Tadcaster West at an average of £301,041 and Cawood With Wistow at an average of £338,345.
Which train stations are available in or near Tadcaster?
Some of the train stations available in or near Tadcaster are Ulleskelf, Church Fenton and Sherburn-In-Elmet.
Property Price Paid in Tadcaster by Year
The average sold property price by year was:
| Year | Average Sold Price | Price Change |
Sold Properties
|
|---|---|---|---|
| 2024 | £423,131 | 18% |
9 Properties |
| 2023 | £345,643 | 7% |
120 Properties |
| 2022 | £320,676 | 4% |
192 Properties |
| 2021 | £308,143 | 8% |
218 Properties |
| 2020 | £283,686 | -3% |
153 Properties |
| 2019 | £291,013 | 7% |
235 Properties |
| 2018 | £271,348 | 2% |
233 Properties |
| 2017 | £264,586 | 3% |
211 Properties |
| 2016 | £256,323 | 4% |
243 Properties |
| 2015 | £246,729 | 10% |
183 Properties |
| 2014 | £221,717 | 5% |
190 Properties |
| 2013 | £211,370 | -9% |
151 Properties |
| 2012 | £230,638 | 9% |
127 Properties |
| 2011 | £209,750 | 1% |
114 Properties |
| 2010 | £206,905 | -5% |
163 Properties |
| 2009 | £216,456 | -1% |
153 Properties |
| 2008 | £219,681 | -5% |
131 Properties |
| 2007 | £229,812 | 3% |
256 Properties |
| 2006 | £222,870 | 12% |
307 Properties |
| 2005 | £196,724 | 4% |
164 Properties |
| 2004 | £187,975 | 9% |
203 Properties |
| 2003 | £170,887 | 22% |
229 Properties |
| 2002 | £133,837 | 21% |
231 Properties |
| 2001 | £105,296 | 3% |
193 Properties |
| 2000 | £102,113 | 15% |
236 Properties |
| 1999 | £86,430 | 9% |
267 Properties |
| 1998 | £78,333 | -5% |
192 Properties |
| 1997 | £81,969 | 4% |
181 Properties |
| 1996 | £78,838 | 8% |
171 Properties |
| 1995 | £72,371 | - |
159 Properties |
Property Price per Property Type in Tadcaster
Here you can find historic sold price data in order to help with your property search.
The average Property Paid Price for specific property types in the last three years are:
| Property Type | Average Sold Price | Sold Properties |
|---|---|---|
| Semi Detached House | £281,202.00 | 171 Semi Detached Houses |
| Terraced House | £240,412.00 | 161 Terraced Houses |
| Detached House | £480,421.00 | 170 Detached Houses |
| Flat | £150,452.00 | 37 Flats |