
Houses for sale & to rent in Bridgnorth, Shropshire
House Prices in Bridgnorth
Properties in Bridgnorth have an average house price of £293,050.00 and had 1,160 Property Transactions within the last 3 years.¹
Bridgnorth is an area in Shropshire with 11,320 households², where the most expensive property was sold for £2,869,520.00.
Properties for sale in Bridgnorth


Neighbourhoods in Bridgnorth
Navigate through our locations to find the location of your next house in Bridgnorth, Shropshire for sale or to rent.
Transport in Bridgnorth
Please see below transportation links in this area:
-
 Cosford Station
 -
Albrighton Station
-
Shifnal Station
-
Kidderminster Station
-
Telford Central Station
-
Codsall Station
-
Stourbridge Town Station
-
Bilbrook Station
-
Blakedown Station
-
Oakengates Station
- FAQ
- Price Paid By Year
- Property Type Price
Frequently asked questions about Bridgnorth
What is the average price for a property for sale in Bridgnorth?
The average price for a property for sale in Bridgnorth is £293,050. This amount is 2% lower than the average price in Shropshire. There are 7,429 property listings for sale in Bridgnorth.
What locations have the most expensive properties for sale in Bridgnorth?
The locations with the most expensive properties for sale in Bridgnorth are Cleobury Mortimer at an average of £556,944, Worfield at an average of £483,890 and Brown Clee at an average of £422,669.
What locations have the most affordable properties for sale in Bridgnorth?
The locations with the most affordable properties for sale in Bridgnorth are Highley at an average of £206,732, Bridgnorth West And Tasley at an average of £263,780 and Bridgnorth East And Astley Abbotts at an average of £289,358.
Which train stations are available in or near Bridgnorth?
Some of the train stations available in or near Bridgnorth are Cosford, Albrighton and Shifnal.
Property Price Paid in Bridgnorth by Year
The average sold property price by year was:
| Year | Average Sold Price | Price Change |
Sold Properties
|
|---|---|---|---|
| 2024 | £387,620 | 23% |
26 Properties |
| 2023 | £299,642 | 5% |
271 Properties |
| 2022 | £284,111 | -2% |
372 Properties |
| 2021 | £291,177 | 10% |
491 Properties |
| 2020 | £261,929 | 7% |
332 Properties |
| 2019 | £243,670 | -5% |
381 Properties |
| 2018 | £256,261 | 11% |
423 Properties |
| 2017 | £228,370 | -3% |
441 Properties |
| 2016 | £236,162 | 4% |
455 Properties |
| 2015 | £227,336 | 10% |
428 Properties |
| 2014 | £204,353 | -1% |
375 Properties |
| 2013 | £207,030 | -1% |
331 Properties |
| 2012 | £209,094 | -4% |
290 Properties |
| 2011 | £216,472 | -4% |
263 Properties |
| 2010 | £224,880 | 5% |
298 Properties |
| 2009 | £214,582 | -10% |
322 Properties |
| 2008 | £236,725 | 5% |
272 Properties |
| 2007 | £224,780 | 0,2% |
427 Properties |
| 2006 | £224,425 | 6% |
509 Properties |
| 2005 | £211,210 | 13% |
380 Properties |
| 2004 | £184,699 | -0,3% |
409 Properties |
| 2003 | £185,253 | 18% |
426 Properties |
| 2002 | £151,820 | 18% |
487 Properties |
| 2001 | £124,168 | 7% |
532 Properties |
| 2000 | £115,942 | 21% |
392 Properties |
| 1999 | £91,281 | 2% |
513 Properties |
| 1998 | £89,812 | 10% |
448 Properties |
| 1997 | £81,118 | 7% |
563 Properties |
| 1996 | £75,670 | 5% |
419 Properties |
| 1995 | £72,064 | - |
372 Properties |
Property Price per Property Type in Bridgnorth
Here you can find historic sold price data in order to help with your property search.
The average Property Paid Price for specific property types in the last three years are:
| Property Type | Average Sold Price | Sold Properties |
|---|---|---|
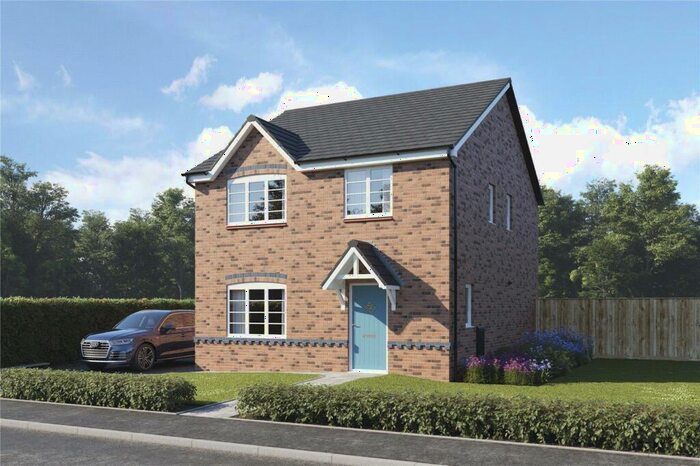
| Semi Detached House | £246,655.00 | 346 Semi Detached Houses |
| Terraced House | £224,127.00 | 309 Terraced Houses |
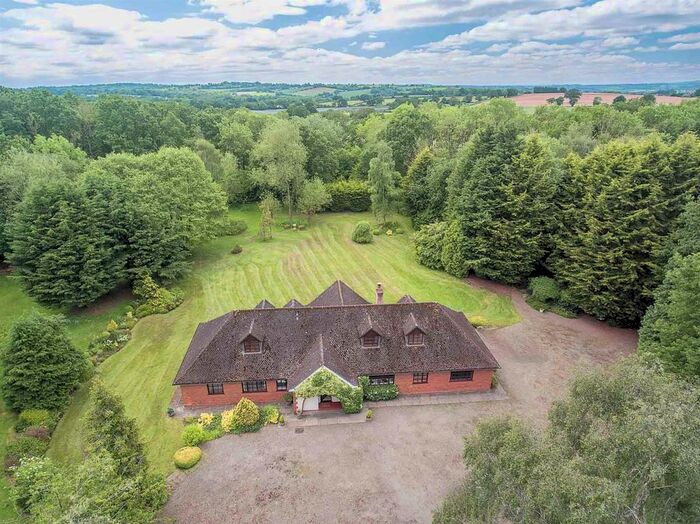
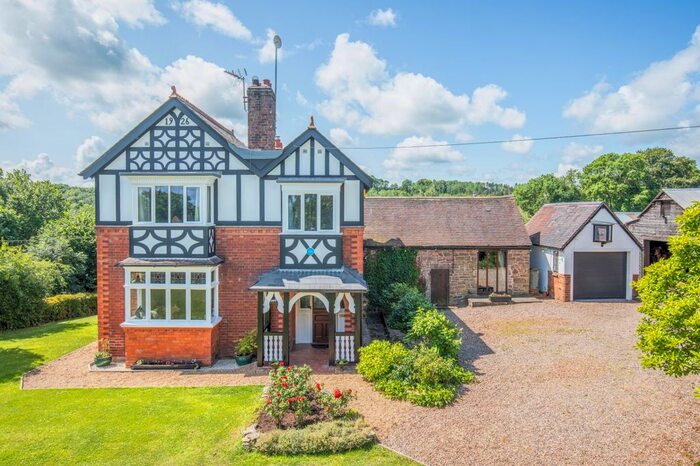
| Detached House | £432,212.00 | 392 Detached Houses |
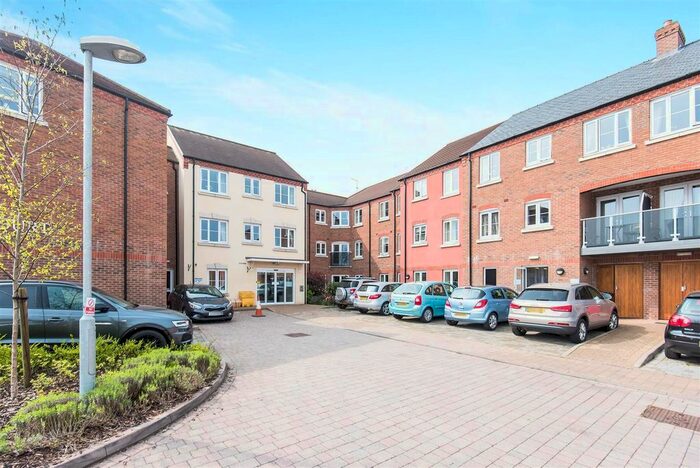
| Flat | £140,825.00 | 113 Flats |