
Houses for sale & to rent in Market Drayton, Shropshire
House Prices in Market Drayton
Properties in Market Drayton have an average house price of £288,587.00 and had 975 Property Transactions within the last 3 years.¹
Market Drayton is an area in Shropshire with 8,296 households², where the most expensive property was sold for £2,200,000.00.
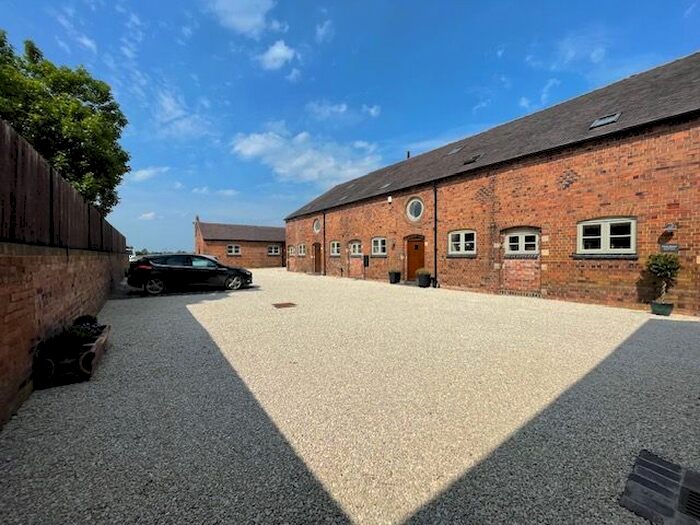
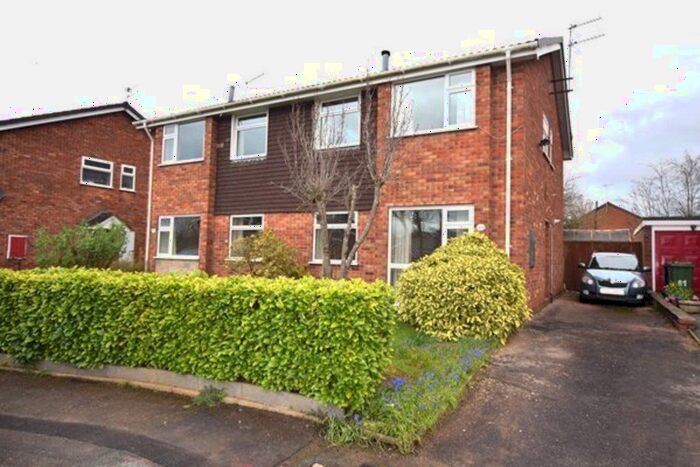
Properties for sale in Market Drayton


Neighbourhoods in Market Drayton
Navigate through our locations to find the location of your next house in Market Drayton, Shropshire for sale or to rent.
Transport in Market Drayton
Please see below transportation links in this area:

- FAQ
- Price Paid By Year
- Property Type Price
Frequently asked questions about Market Drayton
What is the average price for a property for sale in Market Drayton?
The average price for a property for sale in Market Drayton is £288,587. This amount is 3% lower than the average price in Shropshire. There are 2,546 property listings for sale in Market Drayton.
What locations have the most expensive properties for sale in Market Drayton?
The locations with the most expensive properties for sale in Market Drayton are Prees at an average of £437,702, Hodnet at an average of £364,590 and Cheswardine at an average of £350,392.
What locations have the most affordable properties for sale in Market Drayton?
The locations with the most affordable properties for sale in Market Drayton are Market Drayton West at an average of £232,965 and Market Drayton East at an average of £303,966.
Which train stations are available in or near Market Drayton?
Some of the train stations available in or near Market Drayton are Prees, Whitchurch (Salop) and Wem.
Property Price Paid in Market Drayton by Year
The average sold property price by year was:
| Year | Average Sold Price | Price Change |
Sold Properties
|
|---|---|---|---|
| 2024 | £279,760 | -6% |
19 Properties |
| 2023 | £297,278 | -6% |
199 Properties |
| 2022 | £314,481 | 15% |
315 Properties |
| 2021 | £266,599 | 8% |
442 Properties |
| 2020 | £245,821 | 3% |
332 Properties |
| 2019 | £239,132 | 2% |
357 Properties |
| 2018 | £233,876 | 4% |
355 Properties |
| 2017 | £223,914 | 2% |
327 Properties |
| 2016 | £220,035 | 7% |
324 Properties |
| 2015 | £205,720 | 7% |
311 Properties |
| 2014 | £191,751 | 2% |
274 Properties |
| 2013 | £187,733 | -1% |
260 Properties |
| 2012 | £190,485 | 0,3% |
195 Properties |
| 2011 | £189,998 | -4% |
167 Properties |
| 2010 | £198,111 | 8% |
197 Properties |
| 2009 | £182,930 | -24% |
184 Properties |
| 2008 | £227,023 | 12% |
185 Properties |
| 2007 | £198,723 | 3% |
346 Properties |
| 2006 | £192,666 | 9% |
436 Properties |
| 2005 | £174,995 | 5% |
370 Properties |
| 2004 | £166,778 | 12% |
441 Properties |
| 2003 | £146,234 | 20% |
414 Properties |
| 2002 | £116,287 | 14% |
492 Properties |
| 2001 | £99,533 | 9% |
448 Properties |
| 2000 | £90,088 | 8% |
327 Properties |
| 1999 | £82,967 | 2% |
448 Properties |
| 1998 | £80,989 | 6% |
389 Properties |
| 1997 | £75,779 | 11% |
367 Properties |
| 1996 | £67,097 | 5% |
356 Properties |
| 1995 | £63,510 | - |
217 Properties |
Property Price per Property Type in Market Drayton
Here you can find historic sold price data in order to help with your property search.
The average Property Paid Price for specific property types in the last three years are:
| Property Type | Average Sold Price | Sold Properties |
|---|---|---|
| Semi Detached House | £210,574.00 | 336 Semi Detached Houses |
| Terraced House | £196,492.00 | 165 Terraced Houses |
| Detached House | £402,853.00 | 430 Detached Houses |
| Flat | £112,986.00 | 44 Flats |