
Houses for sale & to rent in Wigan, St. Helens
House Prices in Wigan
Properties in Wigan have an average house price of £208,724.00 and had 387 Property Transactions within the last 3 years.¹
Wigan is an area in St. Helens with 4,640 households², where the most expensive property was sold for £790,000.00.
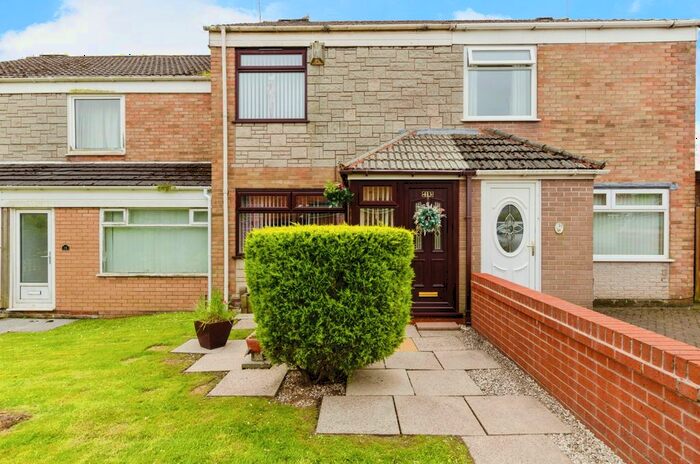
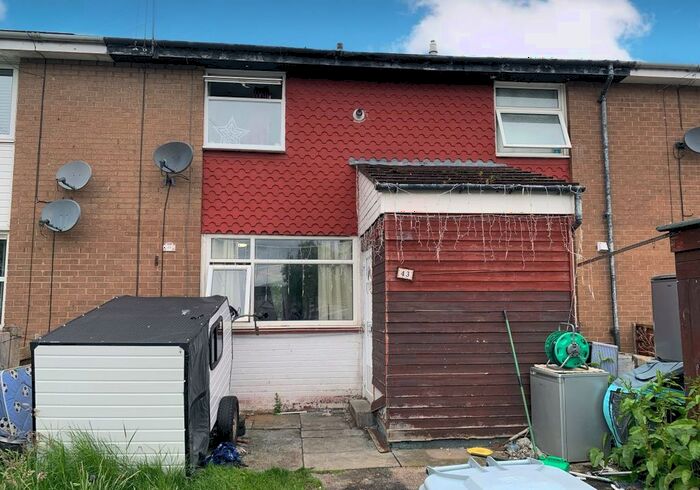
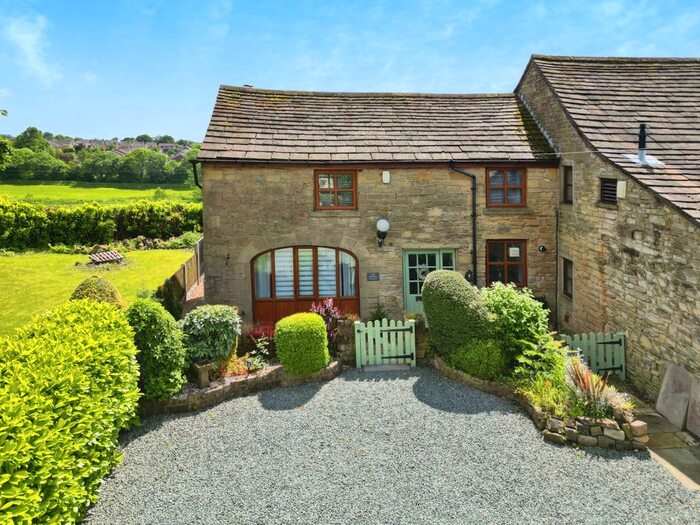
Properties for sale in Wigan


Neighbourhoods in Wigan
Navigate through our locations to find the location of your next house in Wigan, St. Helens for sale or to rent.
Transport in Wigan
Please see below transportation links in this area:

- FAQ
- Price Paid By Year
- Property Type Price
Frequently asked questions about Wigan
What is the average price for a property for sale in Wigan?
The average price for a property for sale in Wigan is £208,724. This amount is 19% higher than the average price in St. Helens. There are 2,805 property listings for sale in Wigan.
What locations have the most expensive properties for sale in Wigan?
The location with the most expensive properties for sale in Wigan is Haydock at an average of £317,000.
What locations have the most affordable properties for sale in Wigan?
The location with the most affordable properties for sale in Wigan is Billinge And Seneley Green at an average of £207,307.
Which train stations are available in or near Wigan?
Some of the train stations available in or near Wigan are Garswood, Bryn and Orrell.
Property Price Paid in Wigan by Year
The average sold property price by year was:
| Year | Average Sold Price | Price Change |
Sold Properties
|
|---|---|---|---|
| 2024 | £253,750 | 11% |
12 Properties |
| 2023 | £224,786 | 5% |
73 Properties |
| 2022 | £212,682 | 9% |
143 Properties |
| 2021 | £194,392 | 17% |
159 Properties |
| 2020 | £160,749 | -6% |
108 Properties |
| 2019 | £170,843 | 4% |
124 Properties |
| 2018 | £163,249 | -4% |
143 Properties |
| 2017 | £169,530 | 7% |
143 Properties |
| 2016 | £158,157 | 5% |
147 Properties |
| 2015 | £149,951 | 5% |
127 Properties |
| 2014 | £142,456 | -1% |
115 Properties |
| 2013 | £143,554 | 2% |
103 Properties |
| 2012 | £141,161 | -7% |
93 Properties |
| 2011 | £151,470 | 3% |
78 Properties |
| 2010 | £147,592 | 13% |
92 Properties |
| 2009 | £128,812 | -16% |
71 Properties |
| 2008 | £149,940 | -3% |
88 Properties |
| 2007 | £154,235 | -3% |
165 Properties |
| 2006 | £159,083 | 8% |
155 Properties |
| 2005 | £145,572 | 14% |
110 Properties |
| 2004 | £125,730 | 19% |
171 Properties |
| 2003 | £102,095 | 15% |
126 Properties |
| 2002 | £86,983 | 14% |
198 Properties |
| 2001 | £74,774 | 8% |
174 Properties |
| 2000 | £68,676 | 5% |
184 Properties |
| 1999 | £65,011 | 13% |
184 Properties |
| 1998 | £56,269 | 7% |
145 Properties |
| 1997 | £52,454 | 3% |
132 Properties |
| 1996 | £51,020 | -8% |
120 Properties |
| 1995 | £55,239 | - |
122 Properties |
Property Price per Property Type in Wigan
Here you can find historic sold price data in order to help with your property search.
The average Property Paid Price for specific property types in the last three years are:
| Property Type | Average Sold Price | Sold Properties |
|---|---|---|
| Semi Detached House | £197,403.00 | 233 Semi Detached Houses |
| Terraced House | £142,416.00 | 64 Terraced Houses |
| Flat | £81,388.00 | 9 Flats |
| Detached House | £307,832.00 | 81 Detached Houses |