
Houses for sale & to rent in Lichfield, Staffordshire
House Prices in Lichfield
Properties in Lichfield have an average house price of £342,868.00 and had 2,371 Property Transactions within the last 3 years.¹
Lichfield is an area in Staffordshire with 18,073 households², where the most expensive property was sold for £2,400,000.00.
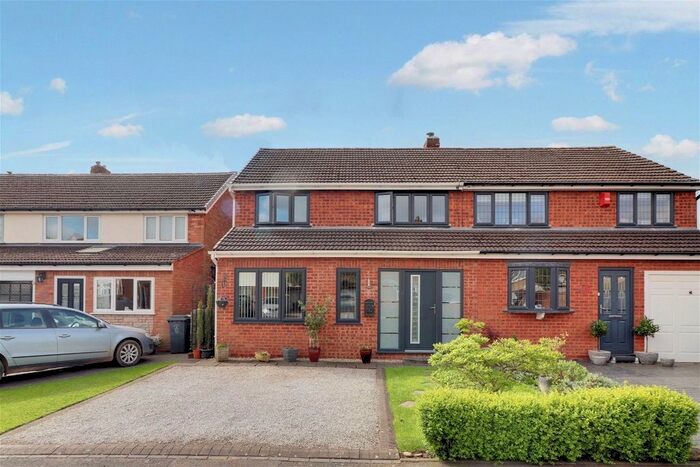
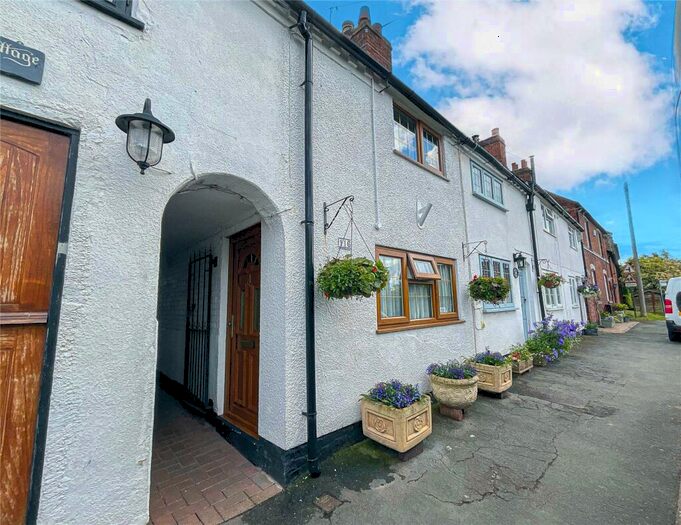
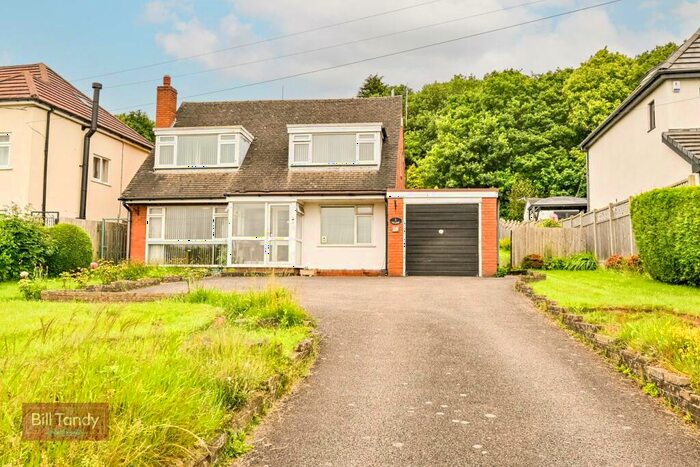
Properties for sale in Lichfield


Neighbourhoods in Lichfield
Navigate through our locations to find the location of your next house in Lichfield, Staffordshire for sale or to rent.
Transport in Lichfield
Please see below transportation links in this area:

- FAQ
- Price Paid By Year
- Property Type Price
Frequently asked questions about Lichfield
What is the average price for a property for sale in Lichfield?
The average price for a property for sale in Lichfield is £342,868. This amount is 30% higher than the average price in Staffordshire. There are more than 10,000 property listings for sale in Lichfield.
What locations have the most expensive properties for sale in Lichfield?
The locations with the most expensive properties for sale in Lichfield are Highfield at an average of £610,000, Stonnall at an average of £566,333 and Shenstone at an average of £543,888.
What locations have the most affordable properties for sale in Lichfield?
The locations with the most affordable properties for sale in Lichfield are Stowe at an average of £259,384, Chadsmead at an average of £289,338 and Alrewas & Fradley at an average of £295,904.
Which train stations are available in or near Lichfield?
Some of the train stations available in or near Lichfield are Lichfield City, Lichfield Trent Valley and Shenstone.
Property Price Paid in Lichfield by Year
The average sold property price by year was:
| Year | Average Sold Price | Price Change |
Sold Properties
|
|---|---|---|---|
| 2024 | £357,294 | 4% |
49 Properties |
| 2023 | £341,738 | -6% |
515 Properties |
| 2022 | £361,237 | 9% |
778 Properties |
| 2021 | £328,859 | 2% |
1,029 Properties |
| 2020 | £323,420 | -9% |
768 Properties |
| 2019 | £353,472 | 16% |
1,052 Properties |
| 2018 | £296,792 | 2% |
1,002 Properties |
| 2017 | £290,738 | 9% |
939 Properties |
| 2016 | £263,648 | 3% |
804 Properties |
| 2015 | £254,493 | 3% |
761 Properties |
| 2014 | £246,909 | 9% |
849 Properties |
| 2013 | £225,617 | -1% |
653 Properties |
| 2012 | £227,980 | 4% |
532 Properties |
| 2011 | £219,987 | -2% |
512 Properties |
| 2010 | £224,399 | 8% |
558 Properties |
| 2009 | £207,210 | -7% |
524 Properties |
| 2008 | £222,020 | -4% |
572 Properties |
| 2007 | £230,580 | 6% |
1,060 Properties |
| 2006 | £216,887 | 4% |
1,203 Properties |
| 2005 | £207,728 | 3% |
972 Properties |
| 2004 | £201,908 | 12% |
963 Properties |
| 2003 | £176,771 | 16% |
990 Properties |
| 2002 | £149,082 | 18% |
1,037 Properties |
| 2001 | £122,641 | 10% |
948 Properties |
| 2000 | £110,965 | 8% |
761 Properties |
| 1999 | £101,814 | 13% |
835 Properties |
| 1998 | £88,799 | 7% |
748 Properties |
| 1997 | £82,731 | 8% |
775 Properties |
| 1996 | £76,394 | -2% |
709 Properties |
| 1995 | £77,989 | - |
589 Properties |
Property Price per Property Type in Lichfield
Here you can find historic sold price data in order to help with your property search.
The average Property Paid Price for specific property types in the last three years are:
| Property Type | Average Sold Price | Sold Properties |
|---|---|---|
| Terraced House | £253,433.00 | 513 Terraced Houses |
| Flat | £174,418.00 | 388 Flats |
| Semi Detached House | £307,150.00 | 632 Semi Detached Houses |
| Detached House | £502,550.00 | 838 Detached Houses |