
Houses for sale & to rent in Beccles, Suffolk
House Prices in Beccles
Properties in Beccles have an average house price of £316,831.00 and had 932 Property Transactions within the last 3 years.¹
Beccles is an area in Suffolk with 8,838 households², where the most expensive property was sold for £1,750,000.00.
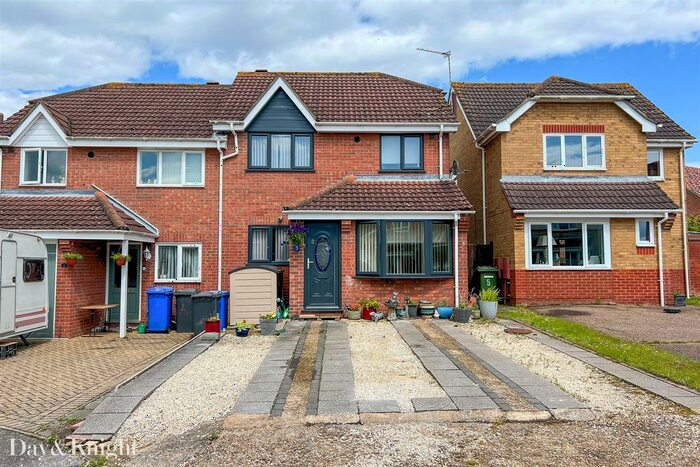
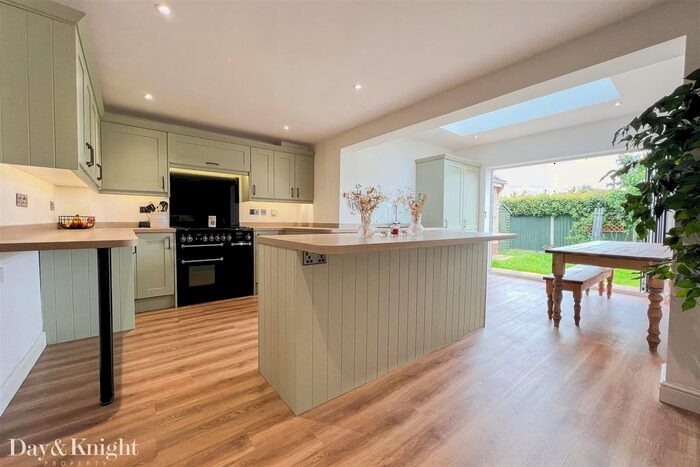
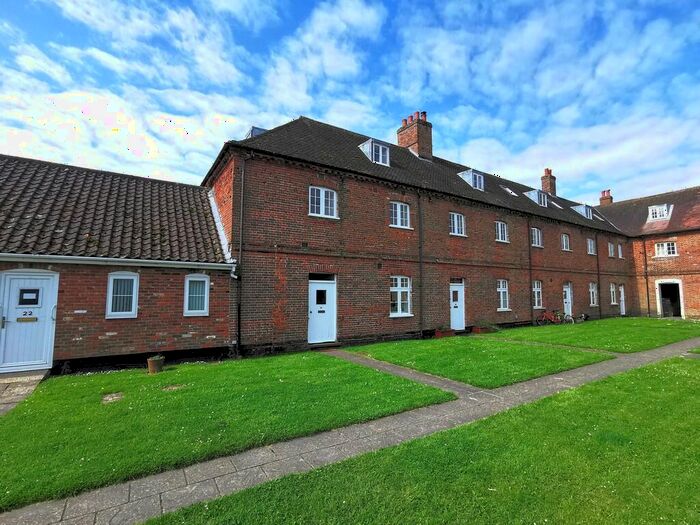
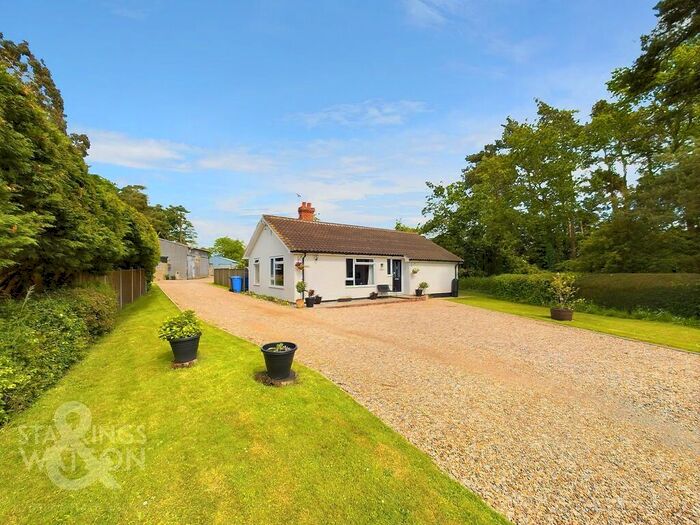
Properties for sale in Beccles


Neighbourhoods in Beccles
Navigate through our locations to find the location of your next house in Beccles, Suffolk for sale or to rent.
Transport in Beccles
Please see below transportation links in this area:
-
 Beccles Station
 -
Brampton (Suffolk) Station
-
Oulton Broad South Station
-
Somerleyton Station
-
Oulton Broad North Station
-
Halesworth Station
-
Haddiscoe Station
-
Lowestoft Station
-
Reedham (Norfolk) Station
- FAQ
- Price Paid By Year
- Property Type Price
Frequently asked questions about Beccles
What is the average price for a property for sale in Beccles?
The average price for a property for sale in Beccles is £316,831. This amount is 1% lower than the average price in Suffolk. There are 6,836 property listings for sale in Beccles.
What locations have the most expensive properties for sale in Beccles?
The locations with the most expensive properties for sale in Beccles are Bungay & Wainford at an average of £979,463, The Saints at an average of £494,642 and Beccles & Worlingham at an average of £483,428.
What locations have the most affordable properties for sale in Beccles?
The locations with the most affordable properties for sale in Beccles are Beccles South at an average of £243,468, Beccles North at an average of £303,904 and Blything at an average of £324,303.
Which train stations are available in or near Beccles?
Some of the train stations available in or near Beccles are Beccles, Brampton (Suffolk) and Oulton Broad South.
Property Price Paid in Beccles by Year
The average sold property price by year was:
| Year | Average Sold Price | Price Change |
Sold Properties
|
|---|---|---|---|
| 2024 | £272,460 | -16% |
15 Properties |
| 2023 | £317,178 | -4% |
204 Properties |
| 2022 | £331,041 | 7% |
308 Properties |
| 2021 | £307,493 | 7% |
405 Properties |
| 2020 | £285,194 | 8% |
277 Properties |
| 2019 | £263,751 | 7% |
335 Properties |
| 2018 | £245,438 | -2% |
320 Properties |
| 2017 | £249,899 | 6% |
371 Properties |
| 2016 | £236,056 | 5% |
354 Properties |
| 2015 | £225,412 | 9% |
331 Properties |
| 2014 | £204,121 | 5% |
366 Properties |
| 2013 | £194,394 | -5% |
301 Properties |
| 2012 | £203,585 | 4% |
253 Properties |
| 2011 | £194,947 | -7% |
264 Properties |
| 2010 | £208,779 | 9% |
267 Properties |
| 2009 | £189,705 | - |
241 Properties |
| 2008 | £189,614 | -5% |
274 Properties |
| 2007 | £198,148 | 14% |
409 Properties |
| 2006 | £171,014 | 3% |
446 Properties |
| 2005 | £166,663 | 3% |
396 Properties |
| 2004 | £162,465 | 12% |
416 Properties |
| 2003 | £143,191 | 22% |
494 Properties |
| 2002 | £111,261 | 14% |
555 Properties |
| 2001 | £95,167 | 14% |
504 Properties |
| 2000 | £81,686 | 16% |
464 Properties |
| 1999 | £68,221 | 5% |
545 Properties |
| 1998 | £64,948 | 0,4% |
447 Properties |
| 1997 | £64,716 | 13% |
437 Properties |
| 1996 | £56,578 | 1% |
408 Properties |
| 1995 | £55,767 | - |
335 Properties |
Property Price per Property Type in Beccles
Here you can find historic sold price data in order to help with your property search.
The average Property Paid Price for specific property types in the last three years are:
| Property Type | Average Sold Price | Sold Properties |
|---|---|---|
| Semi Detached House | £271,740.00 | 244 Semi Detached Houses |
| Terraced House | £225,828.00 | 257 Terraced Houses |
| Detached House | £411,016.00 | 408 Detached Houses |
| Flat | £141,276.00 | 23 Flats |