
Houses for sale & to rent in Ashford, Surrey
House Prices in Ashford
Properties in Ashford have an average house price of £427,491.00 and had 1,367 Property Transactions within the last 3 years.¹
Ashford is an area in Surrey with 11,167 households², where the most expensive property was sold for £1,220,000.00.
Properties for sale in Ashford


Neighbourhoods in Ashford
Navigate through our locations to find the location of your next house in Ashford, Surrey for sale or to rent.
Transport in Ashford
Please see below transportation links in this area:
-
 Ashford (Middlesex) Station
 -
Upper Halliford Station
-
Staines Station
-

 Heathrow Terminal 4 Station
 -
Sunbury Station
-
Kempton Park Station
-
Feltham Station
-
Shepperton Station
-
Heathrow Terminals 1 2 3 Station
-
Heathrow Terminals 2 and 3 Station
- FAQ
- Price Paid By Year
- Property Type Price
Frequently asked questions about Ashford
What is the average price for a property for sale in Ashford?
The average price for a property for sale in Ashford is £427,491. This amount is 36% lower than the average price in Surrey. There are 4,061 property listings for sale in Ashford.
What locations have the most expensive properties for sale in Ashford?
The locations with the most expensive properties for sale in Ashford are Staines South at an average of £455,000, Ashford East at an average of £442,433 and Ashford Town at an average of £436,326.
What locations have the most affordable properties for sale in Ashford?
The locations with the most affordable properties for sale in Ashford are Laleham And Shepperton Green at an average of £312,712, Ashford North And Stanwell South at an average of £402,427 and Ashford Common at an average of £430,756.
Which train stations are available in or near Ashford?
Some of the train stations available in or near Ashford are Ashford (Middlesex), Upper Halliford and Staines.
Which tube stations are available in or near Ashford?
Some of the tube stations available in or near Ashford are Heathrow Terminal 4 and Heathrow Terminals 1 2 3.
Property Price Paid in Ashford by Year
The average sold property price by year was:
| Year | Average Sold Price | Price Change |
Sold Properties
|
|---|---|---|---|
| 2024 | £396,739 | -9% |
23 Properties |
| 2023 | £432,072 | -1% |
295 Properties |
| 2022 | £437,541 | 4% |
455 Properties |
| 2021 | £418,708 | 3% |
594 Properties |
| 2020 | £406,826 | 6% |
382 Properties |
| 2019 | £381,382 | -1% |
442 Properties |
| 2018 | £385,329 | -1% |
401 Properties |
| 2017 | £388,931 | 2% |
431 Properties |
| 2016 | £380,804 | 13% |
474 Properties |
| 2015 | £332,892 | 10% |
537 Properties |
| 2014 | £300,218 | 11% |
521 Properties |
| 2013 | £265,963 | 5% |
536 Properties |
| 2012 | £251,383 | 3% |
428 Properties |
| 2011 | £242,932 | -2% |
352 Properties |
| 2010 | £247,143 | 6% |
399 Properties |
| 2009 | £233,377 | -9% |
335 Properties |
| 2008 | £255,033 | -1% |
345 Properties |
| 2007 | £257,994 | 11% |
654 Properties |
| 2006 | £230,458 | 5% |
670 Properties |
| 2005 | £218,129 | 1% |
496 Properties |
| 2004 | £216,501 | 4% |
587 Properties |
| 2003 | £208,775 | 12% |
652 Properties |
| 2002 | £184,606 | 15% |
647 Properties |
| 2001 | £156,538 | 11% |
571 Properties |
| 2000 | £139,854 | 13% |
514 Properties |
| 1999 | £122,083 | 14% |
680 Properties |
| 1998 | £105,161 | 13% |
546 Properties |
| 1997 | £91,533 | 12% |
589 Properties |
| 1996 | £80,343 | -6% |
533 Properties |
| 1995 | £85,355 | - |
436 Properties |
Property Price per Property Type in Ashford
Here you can find historic sold price data in order to help with your property search.
The average Property Paid Price for specific property types in the last three years are:
| Property Type | Average Sold Price | Sold Properties |
|---|---|---|
| Semi Detached House | £486,618.00 | 520 Semi Detached Houses |
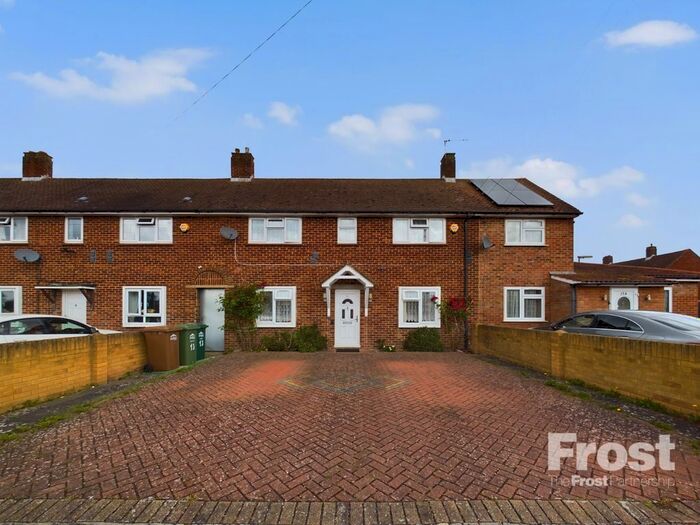
| Terraced House | £407,075.00 | 258 Terraced Houses |
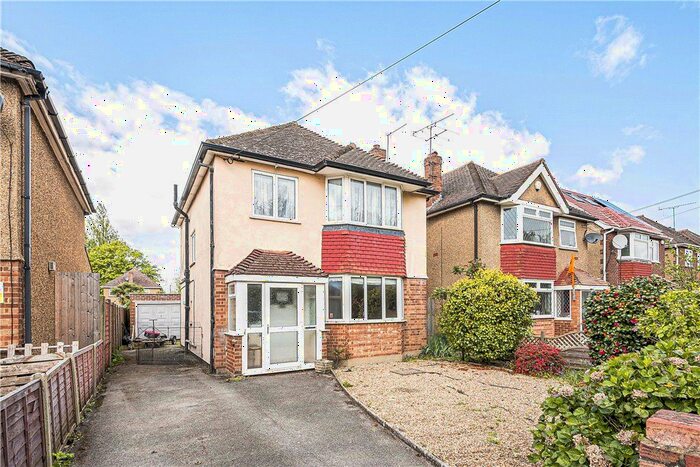
| Detached House | £578,030.00 | 220 Detached Houses |
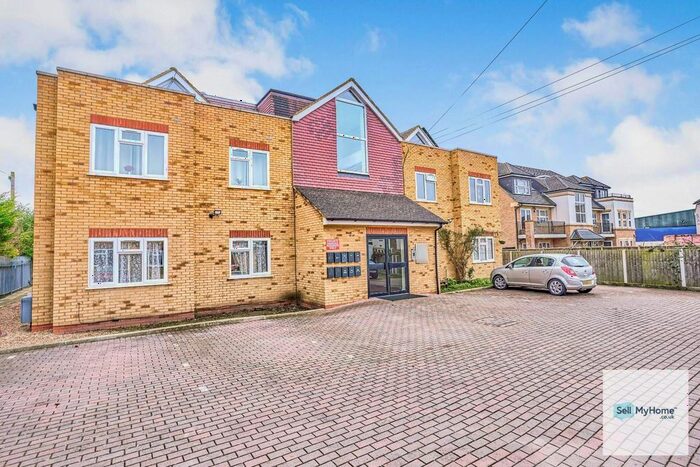
| Flat | £268,690.00 | 369 Flats |