
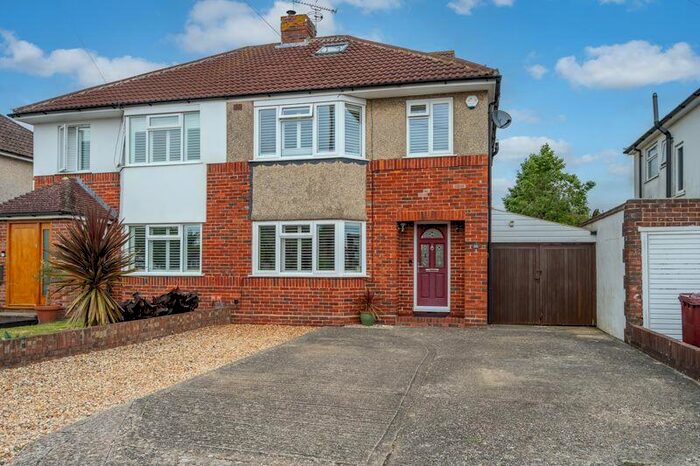
Houses for sale & to rent in Chichester, Surrey
House Prices in Chichester
Properties in Chichester have an average house price of £488,143.00 and had 3,912 Property Transactions within the last 3 years.¹
Chichester is an area in Surrey with 31,367 households², where the most expensive property was sold for £6,000,000.00.
Properties for sale in Chichester


Neighbourhoods in Chichester
Navigate through our locations to find the location of your next house in Chichester, Surrey for sale or to rent.
- Bosham
- Boxgrove
- Chichester East
- Chichester North
- Chichester South
- Chichester West
- Donnington
- East Wittering
- Fishbourne
- Funtington
- Harting
- Lavant
- North Mundham
- Selsey North
- Selsey South
- Sidlesham
- Southbourne
- Stedham
- Tangmere
- West Wittering
- Westbourne
- Harbour Villages
- Chichester Central
- Goodwood
- North Mundham & Tangmere
- Sidlesham with Selsey North
- The Witterings
Transport in Chichester
Please see below transportation links in this area:

- FAQ
- Price Paid By Year
- Property Type Price
Frequently asked questions about Chichester
What is the average price for a property for sale in Chichester?
The average price for a property for sale in Chichester is £488,143. This amount is 23% lower than the average price in Surrey. There are more than 10,000 property listings for sale in Chichester.
What locations have the most expensive properties for sale in Chichester?
The locations with the most expensive properties for sale in Chichester are West Wittering at an average of £943,641, Chichester Central at an average of £941,000 and Funtington at an average of £891,615.
What locations have the most affordable properties for sale in Chichester?
The locations with the most affordable properties for sale in Chichester are Chichester East at an average of £333,353, Selsey North at an average of £334,829 and Tangmere at an average of £343,538.
Which train stations are available in or near Chichester?
Some of the train stations available in or near Chichester are Chichester, Fishbourne and Bosham.
Property Price Paid in Chichester by Year
The average sold property price by year was:
| Year | Average Sold Price | Price Change |
Sold Properties
|
|---|---|---|---|
| 2024 | £469,862 | -4% |
80 Properties |
| 2023 | £488,769 | -6% |
882 Properties |
| 2022 | £517,440 | 10% |
1,242 Properties |
| 2021 | £467,372 | 3% |
1,708 Properties |
| 2020 | £455,285 | 11% |
1,273 Properties |
| 2019 | £405,064 | -3% |
1,254 Properties |
| 2018 | £417,249 | 3% |
1,445 Properties |
| 2017 | £403,325 | 5% |
1,462 Properties |
| 2016 | £384,798 | 6% |
1,499 Properties |
| 2015 | £362,662 | 6% |
1,559 Properties |
| 2014 | £341,688 | 4% |
1,605 Properties |
| 2013 | £328,243 | 3% |
1,427 Properties |
| 2012 | £317,842 | -1% |
1,273 Properties |
| 2011 | £320,885 | 5% |
1,204 Properties |
| 2010 | £303,317 | 9% |
1,258 Properties |
| 2009 | £274,539 | -7% |
1,231 Properties |
| 2008 | £292,998 | -1% |
1,003 Properties |
| 2007 | £296,126 | 9% |
1,834 Properties |
| 2006 | £268,017 | 6% |
1,850 Properties |
| 2005 | £251,175 | 0,1% |
1,478 Properties |
| 2004 | £250,888 | 8% |
1,736 Properties |
| 2003 | £232,016 | 19% |
1,602 Properties |
| 2002 | £186,855 | 14% |
1,842 Properties |
| 2001 | £160,832 | 9% |
1,793 Properties |
| 2000 | £146,388 | 18% |
1,705 Properties |
| 1999 | £120,745 | 10% |
1,909 Properties |
| 1998 | £108,870 | 6% |
1,710 Properties |
| 1997 | £102,802 | 12% |
1,824 Properties |
| 1996 | £90,699 | 4% |
1,548 Properties |
| 1995 | £87,453 | - |
1,168 Properties |
Property Price per Property Type in Chichester
Here you can find historic sold price data in order to help with your property search.
The average Property Paid Price for specific property types in the last three years are:
| Property Type | Average Sold Price | Sold Properties |
|---|---|---|
| Terraced House | £389,719.00 | 887 Terraced Houses |
| Flat | £241,651.00 | 817 Flats |
| Semi Detached House | £417,740.00 | 859 Semi Detached Houses |
| Detached House | £746,974.00 | 1,349 Detached Houses |