
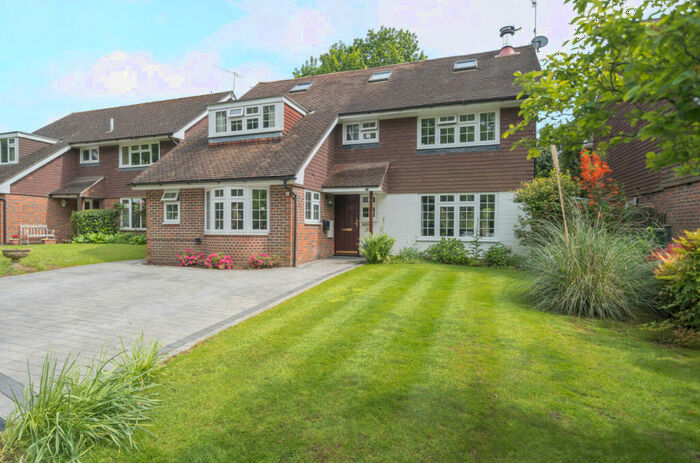
Houses for sale & to rent in Godalming, Surrey
House Prices in Godalming
Properties in Godalming have an average house price of £645,117.00 and had 2,061 Property Transactions within the last 3 years.¹
Godalming is an area in Surrey with 16,183 households², where the most expensive property was sold for £24,600,000.00.
Properties for sale in Godalming


Neighbourhoods in Godalming
Navigate through our locations to find the location of your next house in Godalming, Surrey for sale or to rent.
- Bramley, Busbridge And Hascombe
- Chiddingfold And Dunsfold
- Elstead And Thursley
- Godalming Binscombe
- Godalming Central And Ockford
- Godalming Charterhouse
- Godalming Farncombe And Catteshall
- Godalming Holloway
- Milford
- Pilgrims
- Plaistow
- Shalford
- Witley And Hambledon
- Godalming Farncombe & Catteshall
- Godalming Central & Ockford
- Bramley & Wonersh
- Godalming Binscombe & Charterhouse
- Alfold, Dunsfold & Hascombe
- Chiddingfold
- Milford & Witley
- Elstead & Peper Harow
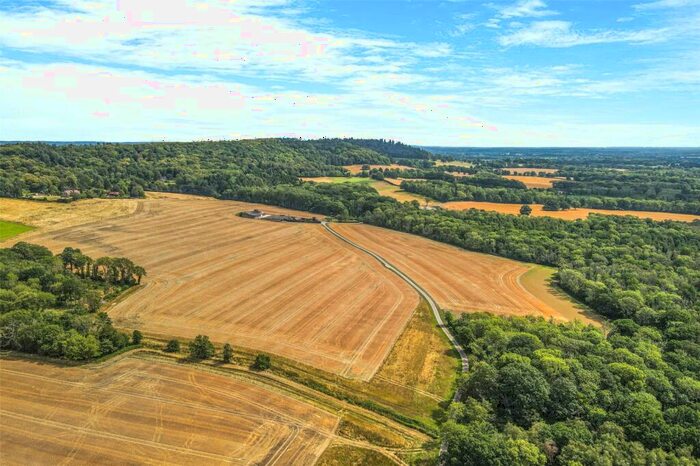
Transport in Godalming
Please see below transportation links in this area:

- FAQ
- Price Paid By Year
- Property Type Price
Frequently asked questions about Godalming
What is the average price for a property for sale in Godalming?
The average price for a property for sale in Godalming is £645,117. This amount is 4% higher than the average price in Surrey. There are more than 10,000 property listings for sale in Godalming.
What locations have the most expensive properties for sale in Godalming?
The locations with the most expensive properties for sale in Godalming are Bramley, Busbridge And Hascombe at an average of £1,688,898, Pilgrims at an average of £1,335,000 and Shalford at an average of £1,266,300.
What locations have the most affordable properties for sale in Godalming?
The locations with the most affordable properties for sale in Godalming are Godalming Farncombe And Catteshall at an average of £433,859, Godalming Central And Ockford at an average of £459,545 and Godalming Binscombe at an average of £486,562.
Which train stations are available in or near Godalming?
Some of the train stations available in or near Godalming are Milford (Surrey), Godalming and Farncombe.
Property Price Paid in Godalming by Year
The average sold property price by year was:
| Year | Average Sold Price | Price Change |
Sold Properties
|
|---|---|---|---|
| 2024 | £535,511 | -28% |
40 Properties |
| 2023 | £682,944 | 4% |
485 Properties |
| 2022 | £654,235 | 5% |
688 Properties |
| 2021 | £621,254 | 11% |
848 Properties |
| 2020 | £550,065 | 3% |
641 Properties |
| 2019 | £530,971 | -3% |
645 Properties |
| 2018 | £546,162 | 5% |
678 Properties |
| 2017 | £518,506 | 2% |
718 Properties |
| 2016 | £509,948 | 6% |
723 Properties |
| 2015 | £478,260 | 3% |
789 Properties |
| 2014 | £461,619 | 6% |
816 Properties |
| 2013 | £432,749 | 3% |
645 Properties |
| 2012 | £420,118 | -3% |
550 Properties |
| 2011 | £434,374 | 5% |
602 Properties |
| 2010 | £414,490 | 4% |
638 Properties |
| 2009 | £396,639 | -6% |
541 Properties |
| 2008 | £421,032 | 3% |
454 Properties |
| 2007 | £408,467 | 13% |
945 Properties |
| 2006 | £356,526 | 9% |
918 Properties |
| 2005 | £323,641 | 6% |
787 Properties |
| 2004 | £303,937 | 2% |
837 Properties |
| 2003 | £298,090 | 9% |
755 Properties |
| 2002 | £270,318 | 10% |
872 Properties |
| 2001 | £242,230 | 12% |
828 Properties |
| 2000 | £213,116 | 14% |
852 Properties |
| 1999 | £182,385 | 8% |
896 Properties |
| 1998 | £167,786 | 14% |
777 Properties |
| 1997 | £144,274 | 10% |
940 Properties |
| 1996 | £129,432 | 10% |
804 Properties |
| 1995 | £116,263 | - |
667 Properties |
Property Price per Property Type in Godalming
Here you can find historic sold price data in order to help with your property search.
The average Property Paid Price for specific property types in the last three years are:
| Property Type | Average Sold Price | Sold Properties |
|---|---|---|
| Terraced House | £450,802.00 | 394 Terraced Houses |
| Flat | £339,461.00 | 471 Flats |
| Semi Detached House | £562,331.00 | 524 Semi Detached Houses |
| Detached House | £1,037,831.00 | 672 Detached Houses |