
Houses for sale & to rent in Oxted, Surrey
House Prices in Oxted
Properties in Oxted have an average house price of £733,613.00 and had 724 Property Transactions within the last 3 years.¹
Oxted is an area in Surrey with 5,987 households², where the most expensive property was sold for £5,175,000.00.
Properties for sale in Oxted


Neighbourhoods in Oxted
Navigate through our locations to find the location of your next house in Oxted, Surrey for sale or to rent.
Transport in Oxted
Please see below transportation links in this area:
-
 Hurst Green Station
 -
Oxted Station
-
Godstone Station
-
Woldingham Station
-
Edenbridge Station
-
Caterham Station
-
Edenbridge Town Station
- FAQ
- Price Paid By Year
- Property Type Price
Frequently asked questions about Oxted
What is the average price for a property for sale in Oxted?
The average price for a property for sale in Oxted is £733,613. This amount is 17% higher than the average price in Surrey. There are 1,688 property listings for sale in Oxted.
What locations have the most expensive properties for sale in Oxted?
The locations with the most expensive properties for sale in Oxted are Limpsfield at an average of £1,068,903 and Oxted North And Tandridge at an average of £680,882.
What locations have the most affordable properties for sale in Oxted?
The location with the most affordable properties for sale in Oxted is Oxted South at an average of £631,105.
Which train stations are available in or near Oxted?
Some of the train stations available in or near Oxted are Hurst Green, Oxted and Godstone.
Property Price Paid in Oxted by Year
The average sold property price by year was:
| Year | Average Sold Price | Price Change |
Sold Properties
|
|---|---|---|---|
| 2024 | £607,846 | -26% |
13 Properties |
| 2023 | £764,062 | 0,2% |
167 Properties |
| 2022 | £762,279 | 8% |
213 Properties |
| 2021 | £704,743 | -1% |
331 Properties |
| 2020 | £714,153 | 12% |
217 Properties |
| 2019 | £630,349 | -1% |
248 Properties |
| 2018 | £639,295 | 7% |
196 Properties |
| 2017 | £597,356 | 10% |
252 Properties |
| 2016 | £538,142 | -9% |
303 Properties |
| 2015 | £585,597 | -2% |
311 Properties |
| 2014 | £598,508 | 14% |
233 Properties |
| 2013 | £514,053 | 3% |
234 Properties |
| 2012 | £498,642 | 0,2% |
219 Properties |
| 2011 | £497,662 | 7% |
198 Properties |
| 2010 | £465,235 | 10% |
197 Properties |
| 2009 | £417,771 | -3% |
178 Properties |
| 2008 | £431,806 | -2% |
137 Properties |
| 2007 | £442,320 | 9% |
302 Properties |
| 2006 | £403,547 | 7% |
355 Properties |
| 2005 | £373,939 | 4% |
298 Properties |
| 2004 | £357,321 | 12% |
326 Properties |
| 2003 | £313,976 | 3% |
259 Properties |
| 2002 | £303,010 | 12% |
307 Properties |
| 2001 | £265,878 | -1% |
259 Properties |
| 2000 | £269,068 | 17% |
258 Properties |
| 1999 | £222,186 | 17% |
293 Properties |
| 1998 | £185,457 | 10% |
261 Properties |
| 1997 | £166,572 | 14% |
291 Properties |
| 1996 | £143,431 | 5% |
291 Properties |
| 1995 | £136,400 | - |
206 Properties |
Property Price per Property Type in Oxted
Here you can find historic sold price data in order to help with your property search.
The average Property Paid Price for specific property types in the last three years are:
| Property Type | Average Sold Price | Sold Properties |
|---|---|---|
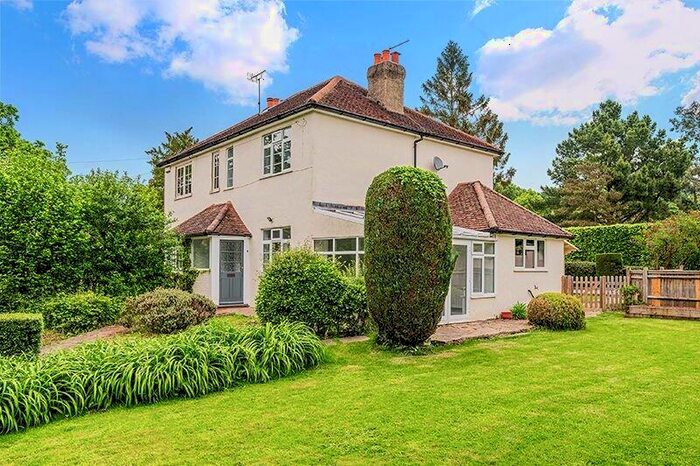
| Semi Detached House | £621,985.00 | 168 Semi Detached Houses |
| Terraced House | £463,760.00 | 143 Terraced Houses |
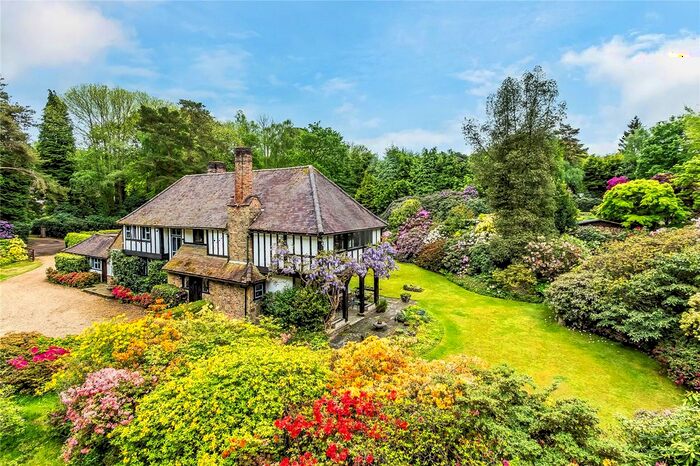
| Detached House | £1,178,882.00 | 250 Detached Houses |
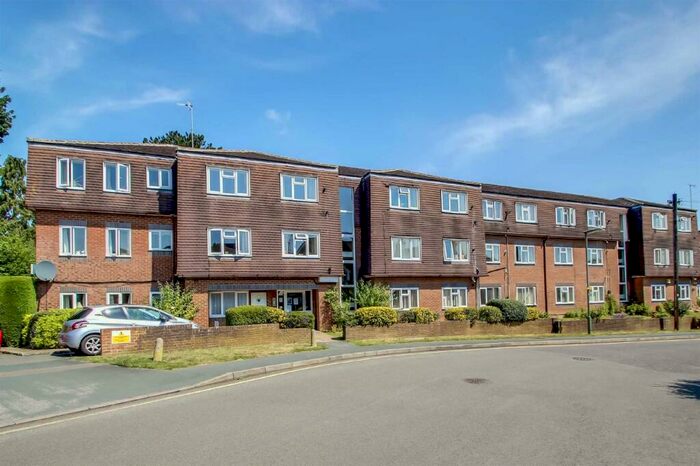
| Flat | £402,479.00 | 163 Flats |