
Houses for sale & to rent in Worcester Park, Sutton London Borough
House Prices in Worcester Park
Properties in this part of Worcester Park within the Sutton London Borough have an average house price of £522,544.00 and had 832 Property Transactions within the last 3 years.¹ This area has 6,595 households² , where the most expensive property was sold for £1,385,000.00.
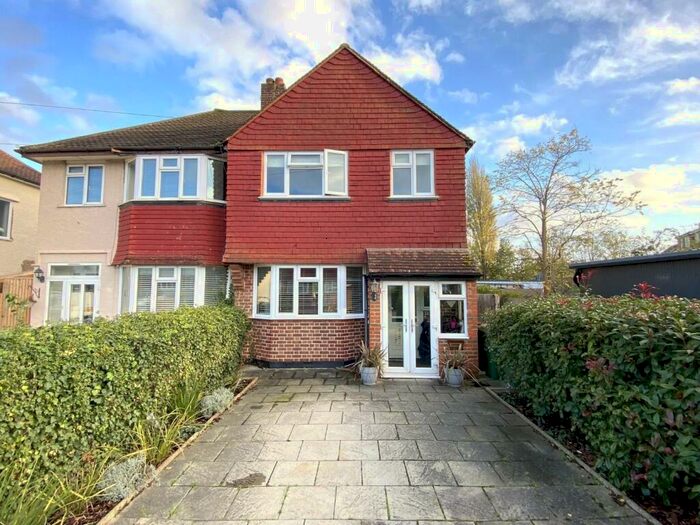
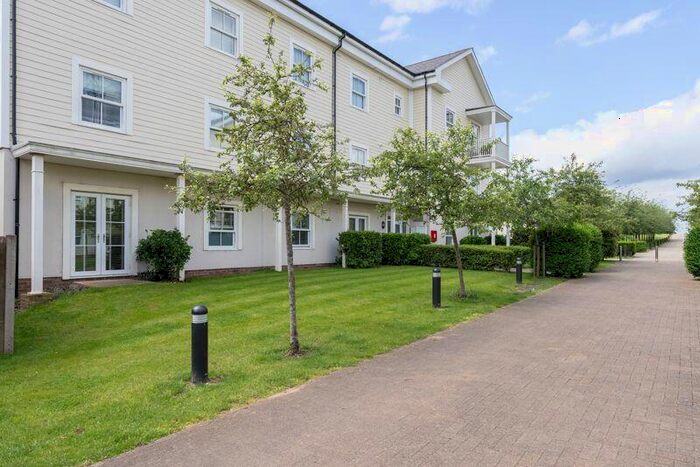
Properties for sale in Worcester Park


Neighbourhoods in Worcester Park
Navigate through our locations to find the location of your next house in Worcester Park, Sutton London Borough for sale or to rent.
Transport in Worcester Park
Please see below transportation links in this area:
-
 Worcester Park Station
 -
Stoneleigh Station
-
Motspur Park Station
-
Malden Manor Station
-
West Sutton Station
-
Sutton Common Station
-
St Helier Station
-
Cheam Station
-
Tolworth Station
-
Morden South Station
- FAQ
- Price Paid By Year
- Property Type Price
Frequently asked questions about Worcester Park
What is the average price for a property for sale in Worcester Park?
The average price for a property for sale in Worcester Park is £522,544. This amount is 10% higher than the average price in Sutton London Borough. There are 2,151 property listings for sale in Worcester Park.
What locations have the most expensive properties for sale in Worcester Park?
The location with the most expensive properties for sale in Worcester Park is Nonsuch at an average of £617,841.
What locations have the most affordable properties for sale in Worcester Park?
The location with the most affordable properties for sale in Worcester Park is Worcester Park at an average of £492,980.
Which train stations are available in or near Worcester Park?
Some of the train stations available in or near Worcester Park are Worcester Park, Stoneleigh and Motspur Park.
Property Price Paid in Worcester Park by Year
The average sold property price by year was:
| Year | Average Sold Price | Price Change |
Sold Properties
|
|---|---|---|---|
| 2024 | £413,725 | -29% |
8 Properties |
| 2023 | £535,737 | 0,2% |
198 Properties |
| 2022 | £534,446 | 5% |
272 Properties |
| 2021 | £508,480 | 2% |
354 Properties |
| 2020 | £496,972 | 9% |
211 Properties |
| 2019 | £450,560 | -2% |
234 Properties |
| 2018 | £460,175 | 0,3% |
263 Properties |
| 2017 | £459,023 | 2% |
296 Properties |
| 2016 | £450,629 | 12% |
259 Properties |
| 2015 | £396,110 | 9% |
333 Properties |
| 2014 | £361,976 | 13% |
347 Properties |
| 2013 | £315,407 | 1% |
300 Properties |
| 2012 | £313,003 | 2% |
264 Properties |
| 2011 | £307,293 | 6% |
276 Properties |
| 2010 | £290,158 | 12% |
244 Properties |
| 2009 | £256,350 | -19% |
236 Properties |
| 2008 | £305,602 | -1% |
205 Properties |
| 2007 | £308,632 | 10% |
466 Properties |
| 2006 | £277,904 | 8% |
514 Properties |
| 2005 | £254,786 | 5% |
367 Properties |
| 2004 | £242,152 | 14% |
382 Properties |
| 2003 | £208,445 | 10% |
377 Properties |
| 2002 | £186,580 | 14% |
453 Properties |
| 2001 | £161,071 | 8% |
420 Properties |
| 2000 | £148,072 | 18% |
344 Properties |
| 1999 | £121,633 | 13% |
441 Properties |
| 1998 | £106,194 | 8% |
356 Properties |
| 1997 | £98,179 | 16% |
412 Properties |
| 1996 | £81,988 | 2% |
362 Properties |
| 1995 | £80,124 | - |
298 Properties |
Property Price per Property Type in Worcester Park
Here you can find historic sold price data in order to help with your property search.
The average Property Paid Price for specific property types in the last three years are:
| Property Type | Average Sold Price | Sold Properties |
|---|---|---|
| Flat | £311,445.00 | 152 Flats |
| Semi Detached House | £624,343.00 | 254 Semi Detached Houses |
| Terraced House | £506,855.00 | 355 Terraced Houses |
| Detached House | £688,741.00 | 71 Detached Houses |