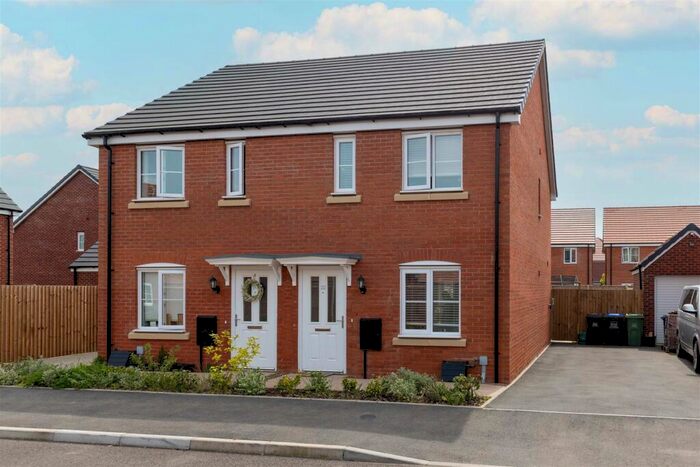
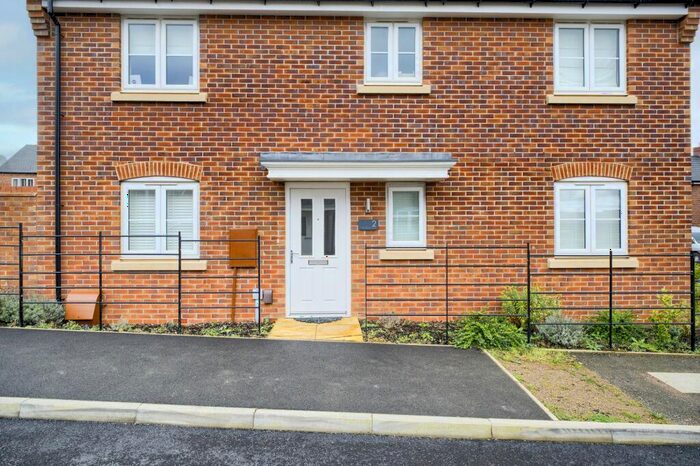
Houses for sale & to rent in Stratford-upon-avon, Warwickshire
House Prices in Stratford-upon-avon
Properties in Stratford-upon-avon have an average house price of £436,853.00 and had 2,450 Property Transactions within the last 3 years.¹
Stratford-upon-avon is an area in Warwickshire with 17,385 households², where the most expensive property was sold for £6,000,000.00.
Properties for sale in Stratford-upon-avon
Neighbourhoods in Stratford-upon-avon
Navigate through our locations to find the location of your next house in Stratford-upon-avon, Warwickshire for sale or to rent.
- Aston Cantlow
- Bardon
- Bidford And Salford
- Claverdon
- Ettington
- Quinton
- Snitterfield
- Stratford Alveston
- Stratford Avenue And New Town
- Stratford Guild And Hathaway
- Stratford Mount Pleasant
- Tredington
- Vale Of The Red Horse
- Welford
- Clopton
- Wotton Wawen
- Welcombe
- Bishopton
- Tiddington
- Bridgetown
- Welford-on-Avon
- Shipston North
- Hathaway
- Shottery
- Alcester & Rural
- Avenue
Transport in Stratford-upon-avon
Please see below transportation links in this area:
- FAQ
- Price Paid By Year
- Property Type Price
Frequently asked questions about Stratford-upon-avon
What is the average price for a property for sale in Stratford-upon-avon?
The average price for a property for sale in Stratford-upon-avon is £436,853. This amount is 26% higher than the average price in Warwickshire. There are 8,354 property listings for sale in Stratford-upon-avon.
What locations have the most expensive properties for sale in Stratford-upon-avon?
The locations with the most expensive properties for sale in Stratford-upon-avon are Vale Of The Red Horse at an average of £925,000, Wotton Wawen at an average of £822,857 and Shottery at an average of £813,333.
What locations have the most affordable properties for sale in Stratford-upon-avon?
The locations with the most affordable properties for sale in Stratford-upon-avon are Clopton at an average of £263,352, Hathaway at an average of £300,125 and Stratford Mount Pleasant at an average of £314,708.
Which train stations are available in or near Stratford-upon-avon?
Some of the train stations available in or near Stratford-upon-avon are Stratford-Upon-Avon, Stratford Pkway and Wilmcote.
Property Price Paid in Stratford-upon-avon by Year
The average sold property price by year was:
| Year | Average Sold Price | Price Change |
Sold Properties
|
|---|---|---|---|
| 2024 | £450,536 | 0,3% |
41 Properties |
| 2023 | £449,333 | 1% |
562 Properties |
| 2022 | £444,435 | 5% |
785 Properties |
| 2021 | £424,115 | 2% |
1,062 Properties |
| 2020 | £416,474 | 7% |
766 Properties |
| 2019 | £385,331 | 6% |
931 Properties |
| 2018 | £361,622 | 0,2% |
1,103 Properties |
| 2017 | £361,036 | 3% |
990 Properties |
| 2016 | £348,932 | 2% |
997 Properties |
| 2015 | £341,277 | 7% |
989 Properties |
| 2014 | £316,333 | 3% |
958 Properties |
| 2013 | £306,514 | -1% |
793 Properties |
| 2012 | £310,182 | 7% |
668 Properties |
| 2011 | £287,180 | -2% |
669 Properties |
| 2010 | £293,468 | 8% |
653 Properties |
| 2009 | £270,603 | -2% |
623 Properties |
| 2008 | £275,787 | -2% |
563 Properties |
| 2007 | £280,531 | 9% |
1,078 Properties |
| 2006 | £255,331 | 1% |
1,293 Properties |
| 2005 | £253,176 | 1% |
1,036 Properties |
| 2004 | £251,372 | 7% |
1,291 Properties |
| 2003 | £232,592 | 12% |
1,019 Properties |
| 2002 | £204,999 | 18% |
1,089 Properties |
| 2001 | £167,261 | 5% |
954 Properties |
| 2000 | £158,368 | 12% |
742 Properties |
| 1999 | £139,215 | 13% |
889 Properties |
| 1998 | £121,782 | 11% |
725 Properties |
| 1997 | £108,286 | 3% |
856 Properties |
| 1996 | £104,514 | 0,5% |
708 Properties |
| 1995 | £104,000 | - |
571 Properties |
Property Price per Property Type in Stratford-upon-avon
Here you can find historic sold price data in order to help with your property search.
The average Property Paid Price for specific property types in the last three years are:
| Property Type | Average Sold Price | Sold Properties |
|---|---|---|
| Terraced House | £325,193.00 | 548 Terraced Houses |
| Flat | £224,304.00 | 471 Flats |
| Semi Detached House | £385,184.00 | 602 Semi Detached Houses |
| Detached House | £668,945.00 | 829 Detached Houses |


