
Houses for sale & to rent in Birmingham, Worcestershire
House Prices in Birmingham
Properties in Birmingham have an average house price of £421,198.00 and had 1,405 Property Transactions within the last 3 years.¹
Birmingham is an area in Worcestershire with 11,687 households², where the most expensive property was sold for £2,250,000.00.
Properties for sale in Birmingham


Neighbourhoods in Birmingham
Navigate through our locations to find the location of your next house in Birmingham, Worcestershire for sale or to rent.
- Alvechurch
- Beacon
- Drakes Cross And Walkers Heath
- Hillside
- Hollywood And Majors Green
- Linthurst
- Marlbrook
- Tardebigge
- Uffdown
- Waseley
- Wythall South
- Hollywood
- Belbroughton & Romsley
- Wythall West
- Barnt Green & Hopwood
- Cofton
- Lickey Hills
- Rubery South
- Rubery North
- Drakes Cross
- Wythall East
- Tanworth-in-Arden
- Alvechurch South
- Alvechurch Village
Transport in Birmingham
Please see below transportation links in this area:

- FAQ
- Price Paid By Year
- Property Type Price
Frequently asked questions about Birmingham
What is the average price for a property for sale in Birmingham?
The average price for a property for sale in Birmingham is £421,198. This amount is 29% higher than the average price in Worcestershire. There are more than 10,000 property listings for sale in Birmingham.
What locations have the most expensive properties for sale in Birmingham?
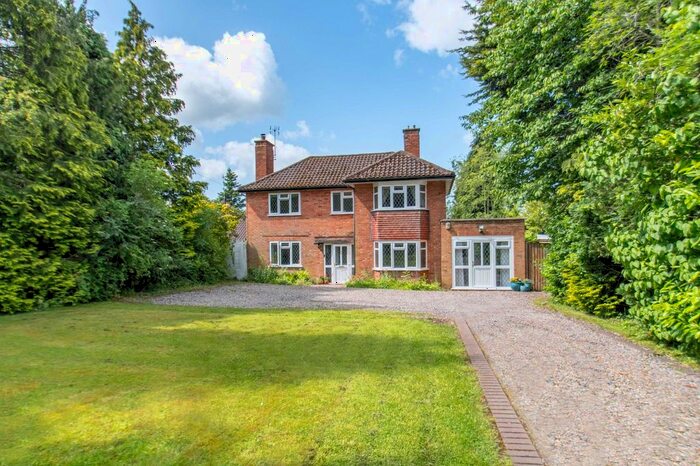
The locations with the most expensive properties for sale in Birmingham are Linthurst at an average of £1,176,029, Uffdown at an average of £585,000 and Hillside at an average of £527,359.
What locations have the most affordable properties for sale in Birmingham?
The locations with the most affordable properties for sale in Birmingham are Rubery South at an average of £198,875, Waseley at an average of £236,783 and Beacon at an average of £307,157.
Which train stations are available in or near Birmingham?
Some of the train stations available in or near Birmingham are Longbridge, Barnt Green and Alvechurch.
Property Price Paid in Birmingham by Year
The average sold property price by year was:
| Year | Average Sold Price | Price Change |
Sold Properties
|
|---|---|---|---|
| 2024 | £365,166 | -19% |
15 Properties |
| 2023 | £435,297 | -1% |
323 Properties |
| 2022 | £437,780 | 8% |
462 Properties |
| 2021 | £402,397 | 9% |
605 Properties |
| 2020 | £367,297 | 3% |
435 Properties |
| 2019 | £354,549 | -4% |
498 Properties |
| 2018 | £368,280 | 8% |
526 Properties |
| 2017 | £339,962 | 5% |
555 Properties |
| 2016 | £324,215 | 5% |
604 Properties |
| 2015 | £306,644 | 4% |
550 Properties |
| 2014 | £293,827 | 12% |
541 Properties |
| 2013 | £257,228 | -4% |
504 Properties |
| 2012 | £268,717 | 0,3% |
356 Properties |
| 2011 | £267,887 | 2% |
340 Properties |
| 2010 | £262,843 | 1% |
305 Properties |
| 2009 | £260,134 | -8% |
313 Properties |
| 2008 | £280,093 | 4% |
230 Properties |
| 2007 | £270,263 | 4% |
507 Properties |
| 2006 | £260,111 | 7% |
623 Properties |
| 2005 | £241,865 | -1% |
468 Properties |
| 2004 | £243,172 | 17% |
594 Properties |
| 2003 | £202,049 | 13% |
548 Properties |
| 2002 | £176,494 | 18% |
635 Properties |
| 2001 | £145,312 | -6% |
589 Properties |
| 2000 | £154,124 | 11% |
490 Properties |
| 1999 | £136,664 | 13% |
546 Properties |
| 1998 | £118,982 | 9% |
474 Properties |
| 1997 | £107,962 | 7% |
572 Properties |
| 1996 | £100,136 | 1% |
439 Properties |
| 1995 | £99,511 | - |
383 Properties |
Property Price per Property Type in Birmingham
Here you can find historic sold price data in order to help with your property search.
The average Property Paid Price for specific property types in the last three years are:
| Property Type | Average Sold Price | Sold Properties |
|---|---|---|
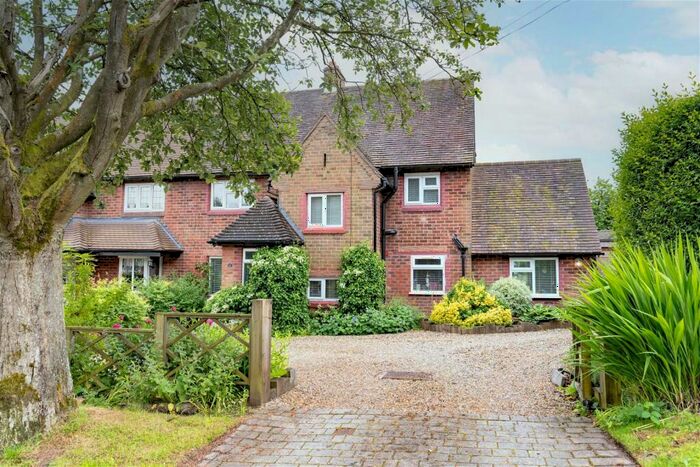
| Semi Detached House | £336,671.00 | 549 Semi Detached Houses |
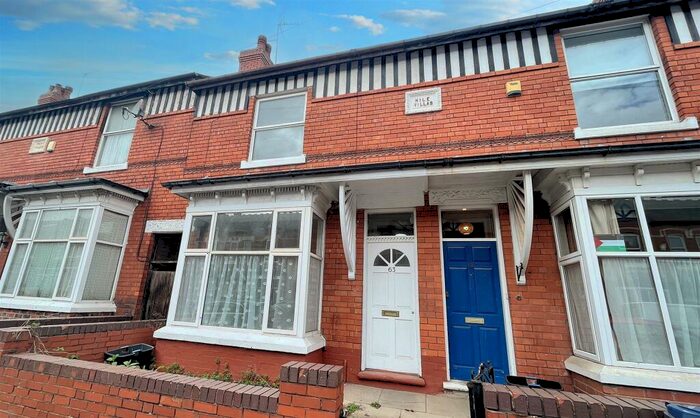
| Terraced House | £280,324.00 | 293 Terraced Houses |
| Detached House | £618,803.00 | 507 Detached Houses |
| Flat | £197,900.00 | 56 Flats |