
Houses for sale & to rent in Bathgate, West Lothian
House Prices in Bathgate
Properties in Bathgate have an average house price of £179,506.00 and had 2,307 Property Transactions within the last 3 years.¹
Bathgate is an area in West Lothian with 27,501 households², where the most expensive property was sold for £1,600,000.00.
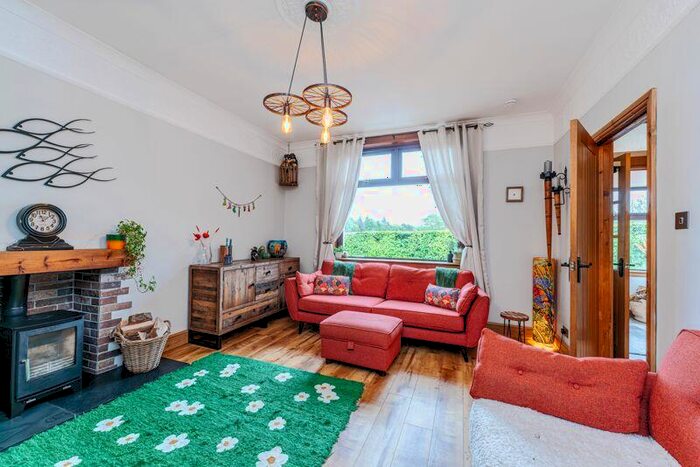
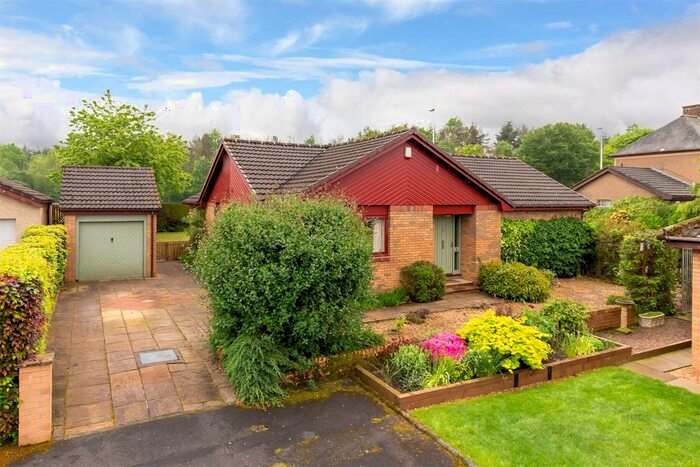
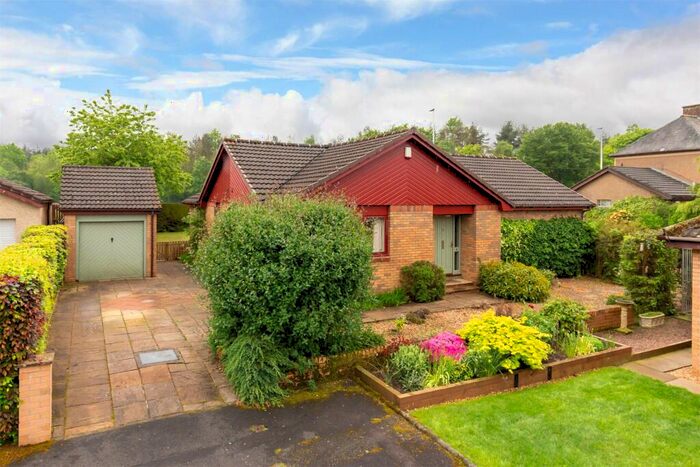
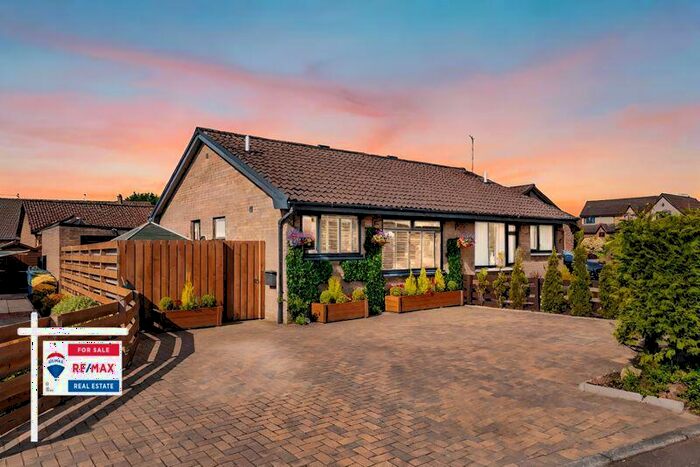
Properties for sale in Bathgate


Neighbourhoods in Bathgate
Navigate through our locations to find the location of your next house in Bathgate, West Lothian for sale or to rent.
Transport in Bathgate
Please see below transportation links in this area:
-
 Armadale Station
 -
Bathgate Station
-
Blackridge Station
-
Addiewell Station
-
Breich Station
-
West Calder Station
-
Fauldhouse Station
-
Livingston North Station
- FAQ
- Price Paid By Year
Frequently asked questions about Bathgate
What is the average price for a property for sale in Bathgate?
The average price for a property for sale in Bathgate is £179,506. This amount is 14% lower than the average price in West Lothian. There are 6,404 property listings for sale in Bathgate.
What locations have the most expensive properties for sale in Bathgate?
The locations with the most expensive properties for sale in Bathgate are Armadale and Blackridge at an average of £193,990 and Bathgate at an average of £183,754.
What locations have the most affordable properties for sale in Bathgate?
The locations with the most affordable properties for sale in Bathgate are Fauldhouse and the Breich Valley at an average of £156,331 and Whitburn and Blackburn at an average of £170,859.
Which train stations are available in or near Bathgate?
Some of the train stations available in or near Bathgate are Armadale, Bathgate and Blackridge.
Property Price Paid in Bathgate by Year
The average sold property price by year was:
| Year | Average Sold Price | Price Change |
Sold Properties
|
|---|---|---|---|
| 2023 | £172,942 | -10% |
181 Properties |
| 2022 | £190,522 | 10% |
937 Properties |
| 2021 | £171,823 | 3% |
1,189 Properties |
| 2020 | £167,305 | 7% |
1,086 Properties |
| 2019 | £155,311 | 4% |
1,170 Properties |
| 2018 | £149,550 | 3% |
1,199 Properties |
| 2017 | £144,659 | 3% |
1,325 Properties |
| 2016 | £140,660 | -3% |
1,227 Properties |
| 2015 | £145,030 | 9% |
1,046 Properties |
| 2014 | £131,579 | 3% |
1,015 Properties |
| 2013 | £128,111 | 0,2% |
869 Properties |
| 2012 | £127,831 | -0,1% |
752 Properties |
| 2011 | £127,903 | -8% |
653 Properties |
| 2010 | £138,338 | 9% |
679 Properties |
| 2009 | £125,204 | -0,2% |
752 Properties |
| 2008 | £125,447 | -2% |
1,095 Properties |
| 2007 | £127,622 | 14% |
1,664 Properties |
| 2006 | £109,899 | 16% |
1,445 Properties |
| 2005 | £91,931 | 8% |
1,405 Properties |
| 2004 | £84,919 | 25% |
1,588 Properties |
| 2003 | £63,376 | 2% |
1,741 Properties |
| 2002 | £62,274 | 3% |
1,629 Properties |
| 2001 | £60,129 | -52% |
123 Properties |
| 2000 | £91,581 | - |
6 Properties |