
Houses for sale & to rent in Swansea, Abertawe - Swansea
House Prices in Swansea
Properties in Swansea have an average house price of £212,617.00 and had 10,447 Property Transactions within the last 3 years.¹
Swansea is an area in Abertawe - Swansea with 103,356 households², where the most expensive property was sold for £2,500,000.00.
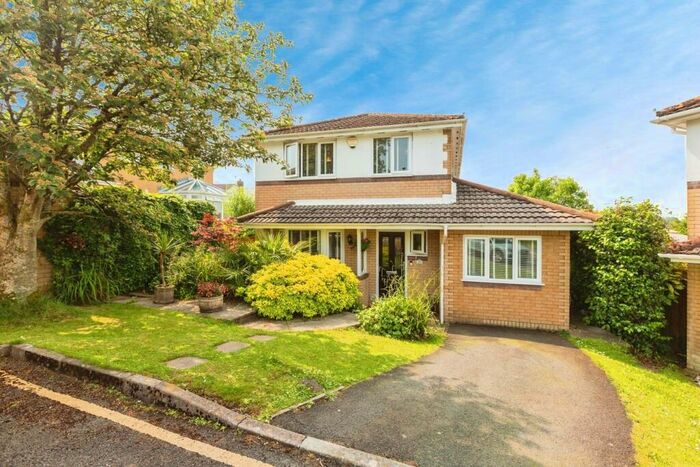
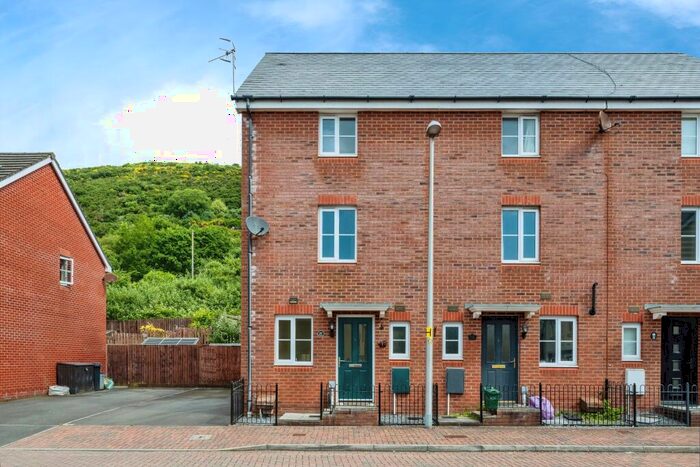
Properties for sale in Swansea


Neighbourhoods in Swansea
Navigate through our locations to find the location of your next house in Swansea, Abertawe - Swansea for sale or to rent.
- Bishopston
- Bonymaen
- Castle
- Clydach
- Cockett
- Cwmbwrla
- Dunvant
- Fairwood
- Gorseinon
- Gower
- Gowerton
- Killay North
- Killay South
- Kingsbridge
- Landore
- Llangyfelach
- Llansamlet
- Lower Loughor
- Mawr
- Mayals
- Morriston
- Mynyddbach
- Newton
- Oystermouth
- Penclawdd
- Penderry
- Penllergaer
- Pennard
- Penyrheol
- Pontardulais
- Sketty
- St. Thomas
- Townhill
- Uplands
- Upper Loughor
- West Cross
- Allt-wen
Transport in Swansea
Please see below transportation links in this area:

- FAQ
- Price Paid By Year
- Property Type Price
Frequently asked questions about Swansea
What is the average price for a property for sale in Swansea?
The average price for a property for sale in Swansea is £212,617. There are more than 10,000 property listings for sale in Swansea.
What locations have the most expensive properties for sale in Swansea?
The locations with the most expensive properties for sale in Swansea are Gower at an average of £465,156, Newton at an average of £447,637 and Pennard at an average of £426,900.
What locations have the most affordable properties for sale in Swansea?
The locations with the most affordable properties for sale in Swansea are Townhill at an average of £106,236, Landore at an average of £116,584 and Cwmbwrla at an average of £128,365.
Which train stations are available in or near Swansea?
Some of the train stations available in or near Swansea are Swansea, Gowerton and Llansamlet.
Property Price Paid in Swansea by Year
The average sold property price by year was:
| Year | Average Sold Price | Price Change |
Sold Properties
|
|---|---|---|---|
| 2024 | £216,513 | 4% |
176 Properties |
| 2023 | £207,847 | -4% |
2,604 Properties |
| 2022 | £216,793 | 2% |
3,528 Properties |
| 2021 | £211,893 | 11% |
4,139 Properties |
| 2020 | £188,713 | 6% |
2,885 Properties |
| 2019 | £176,511 | 2% |
3,566 Properties |
| 2018 | £172,908 | 7% |
3,670 Properties |
| 2017 | £161,666 | -1% |
3,866 Properties |
| 2016 | £163,917 | 6% |
3,669 Properties |
| 2015 | £154,688 | 1% |
3,399 Properties |
| 2014 | £153,393 | 2% |
3,355 Properties |
| 2013 | £151,082 | 1% |
2,833 Properties |
| 2012 | £150,141 | 1% |
2,350 Properties |
| 2011 | £149,323 | -4% |
2,473 Properties |
| 2010 | £155,172 | - |
2,511 Properties |
| 2009 | £155,244 | -1% |
2,683 Properties |
| 2008 | £157,442 | 1% |
2,807 Properties |
| 2007 | £156,513 | 5% |
4,851 Properties |
| 2006 | £148,356 | 6% |
4,941 Properties |
| 2005 | £139,194 | 7% |
3,834 Properties |
| 2004 | £128,916 | 25% |
4,133 Properties |
| 2003 | £97,020 | 19% |
5,067 Properties |
| 2002 | £78,383 | 11% |
5,291 Properties |
| 2001 | £69,938 | 5% |
4,690 Properties |
| 2000 | £66,208 | 10% |
4,232 Properties |
| 1999 | £59,277 | 2% |
4,318 Properties |
| 1998 | £57,900 | 2% |
3,841 Properties |
| 1997 | £56,728 | 7% |
3,942 Properties |
| 1996 | £52,510 | 3% |
3,666 Properties |
| 1995 | £51,037 | - |
2,810 Properties |
Property Price per Property Type in Swansea
Here you can find historic sold price data in order to help with your property search.
The average Property Paid Price for specific property types in the last three years are:
| Property Type | Average Sold Price | Sold Properties |
|---|---|---|
| Terraced House | £153,765.00 | 3,660 Terraced Houses |
| Flat | £147,681.00 | 1,005 Flats |
| Semi Detached House | £196,630.00 | 3,356 Semi Detached Houses |
| Detached House | £350,422.00 | 2,426 Detached Houses |