
Houses for sale & to rent in Newport, Caerffili - Caerphilly
House Prices in Newport
Properties in Newport have an average house price of £162,858.00 and had 1,529 Property Transactions within the last 3 years.¹
Newport is an area in Caerffili - Caerphilly with 15,482 households², where the most expensive property was sold for £1,995,000.00.
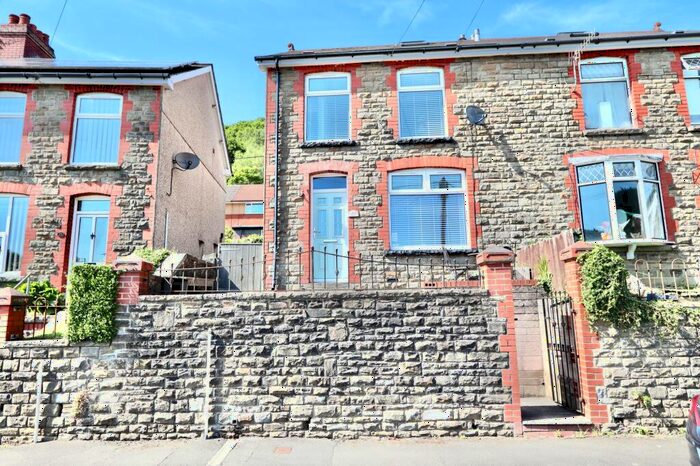
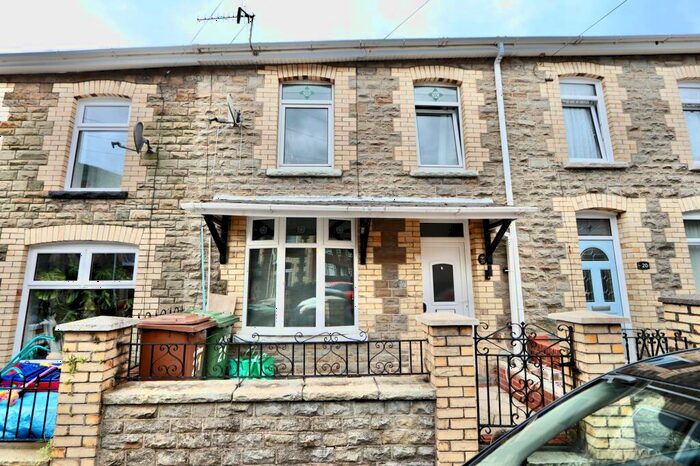
Properties for sale in Newport


Neighbourhoods in Newport
Navigate through our locations to find the location of your next house in Newport, Caerffili - Caerphilly for sale or to rent.
Transport in Newport
Please see below transportation links in this area:

- FAQ
- Price Paid By Year
- Property Type Price
Frequently asked questions about Newport
What is the average price for a property for sale in Newport?
The average price for a property for sale in Newport is £162,858. This amount is 10% lower than the average price in Caerffili - Caerphilly. There are 7,337 property listings for sale in Newport.
What locations have the most expensive properties for sale in Newport?
The locations with the most expensive properties for sale in Newport are Penmaen at an average of £254,772, Risca East at an average of £172,206 and Crumlin at an average of £171,016.
What locations have the most affordable properties for sale in Newport?
The locations with the most affordable properties for sale in Newport are Ynysddu at an average of £143,961, Abercarn at an average of £150,753 and Crosskeys at an average of £151,413.
Which train stations are available in or near Newport?
Some of the train stations available in or near Newport are Crosskeys, Newbridge and Risca and Pontymister.
Property Price Paid in Newport by Year
The average sold property price by year was:
| Year | Average Sold Price | Price Change |
Sold Properties
|
|---|---|---|---|
| 2024 | £186,997 | 13% |
19 Properties |
| 2023 | £162,899 | -4% |
361 Properties |
| 2022 | £170,217 | 9% |
540 Properties |
| 2021 | £155,556 | 10% |
609 Properties |
| 2020 | £139,383 | -0,1% |
440 Properties |
| 2019 | £139,508 | 3% |
558 Properties |
| 2018 | £135,323 | 8% |
551 Properties |
| 2017 | £124,555 | 12% |
666 Properties |
| 2016 | £109,942 | 1% |
531 Properties |
| 2015 | £108,722 | 0,1% |
511 Properties |
| 2014 | £108,633 | 1% |
437 Properties |
| 2013 | £107,279 | 6% |
382 Properties |
| 2012 | £100,952 | -7% |
303 Properties |
| 2011 | £108,281 | 0,3% |
291 Properties |
| 2010 | £107,959 | -1% |
316 Properties |
| 2009 | £109,303 | -14% |
310 Properties |
| 2008 | £124,910 | -6% |
324 Properties |
| 2007 | £132,431 | 9% |
643 Properties |
| 2006 | £119,970 | 12% |
635 Properties |
| 2005 | £104,995 | 19% |
449 Properties |
| 2004 | £85,456 | 21% |
503 Properties |
| 2003 | £67,524 | 19% |
614 Properties |
| 2002 | £54,530 | 13% |
659 Properties |
| 2001 | £47,702 | 8% |
547 Properties |
| 2000 | £43,893 | -6% |
540 Properties |
| 1999 | £46,700 | 11% |
498 Properties |
| 1998 | £41,545 | 6% |
427 Properties |
| 1997 | £38,849 | -2% |
443 Properties |
| 1996 | £39,611 | 2% |
400 Properties |
| 1995 | £38,789 | - |
359 Properties |
Property Price per Property Type in Newport
Here you can find historic sold price data in order to help with your property search.
The average Property Paid Price for specific property types in the last three years are:
| Property Type | Average Sold Price | Sold Properties |
|---|---|---|
| Terraced House | £137,103.00 | 839 Terraced Houses |
| Flat | £102,924.00 | 53 Flats |
| Semi Detached House | £173,521.00 | 503 Semi Detached Houses |
| Detached House | £307,798.00 | 134 Detached Houses |