
Houses for sale & to rent in Machynlleth, Powys - Powys
House Prices in Machynlleth
Properties in Machynlleth have an average house price of £223,168.00 and had 179 Property Transactions within the last 3 years.¹
Machynlleth is an area in Powys - Powys with 1,924 households², where the most expensive property was sold for £665,000.00.
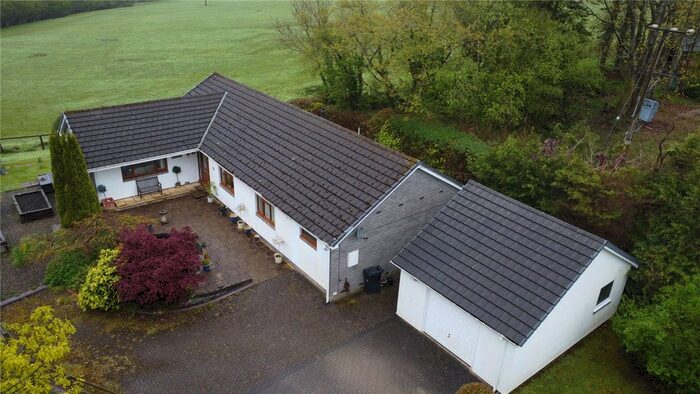
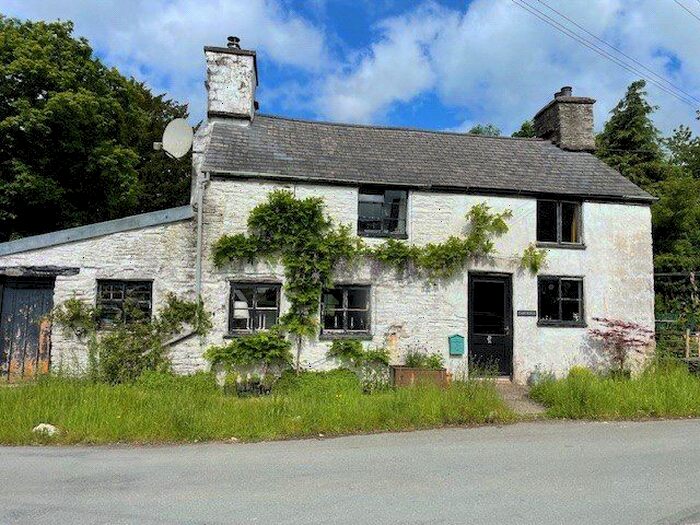
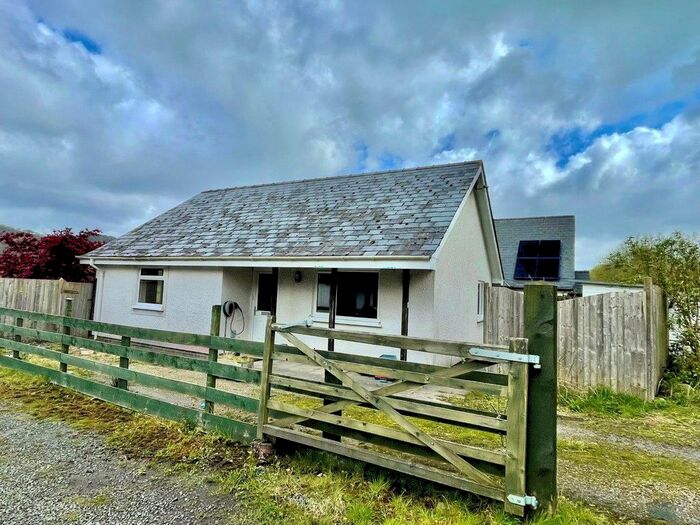
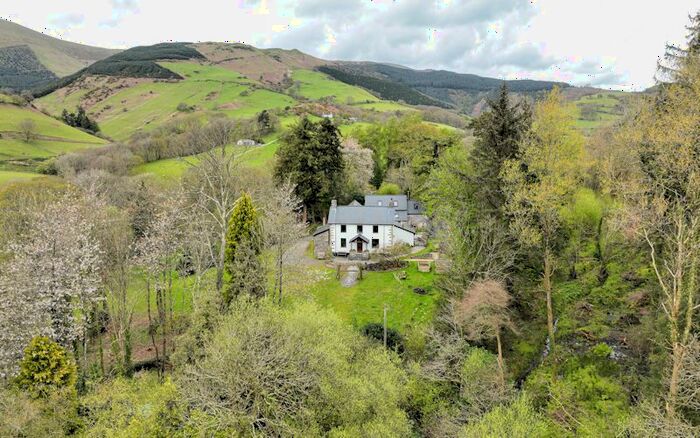
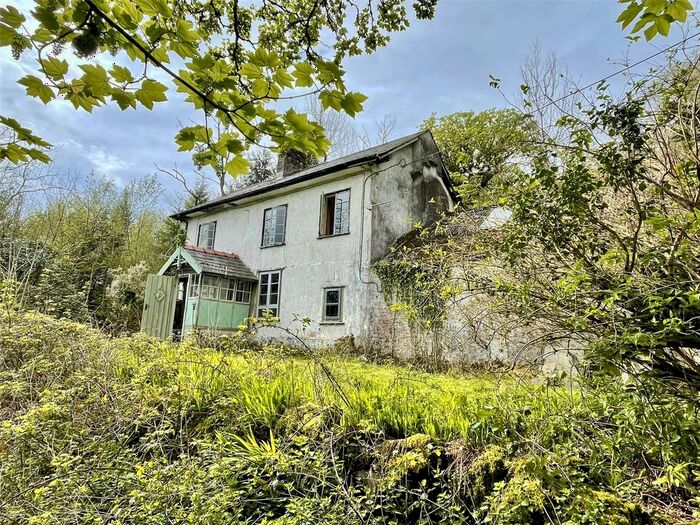
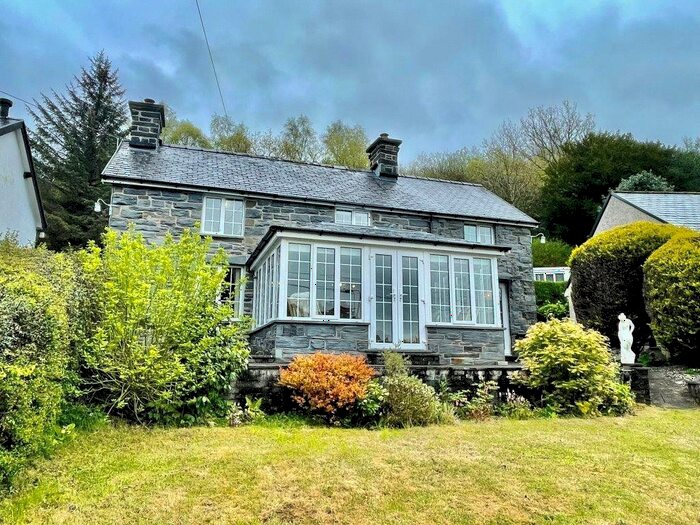
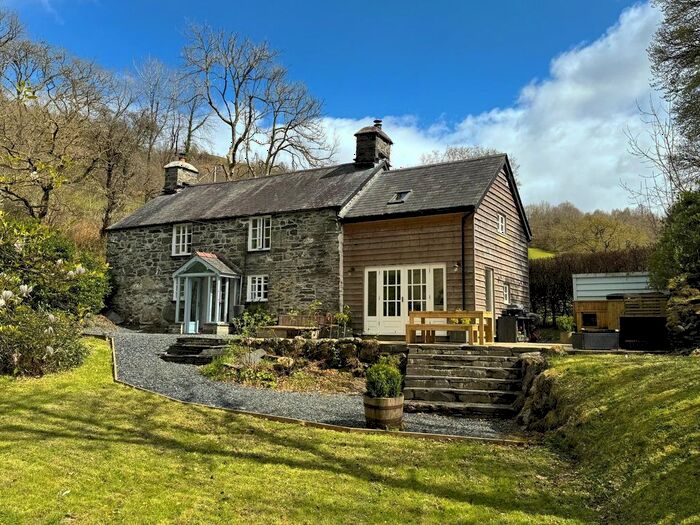
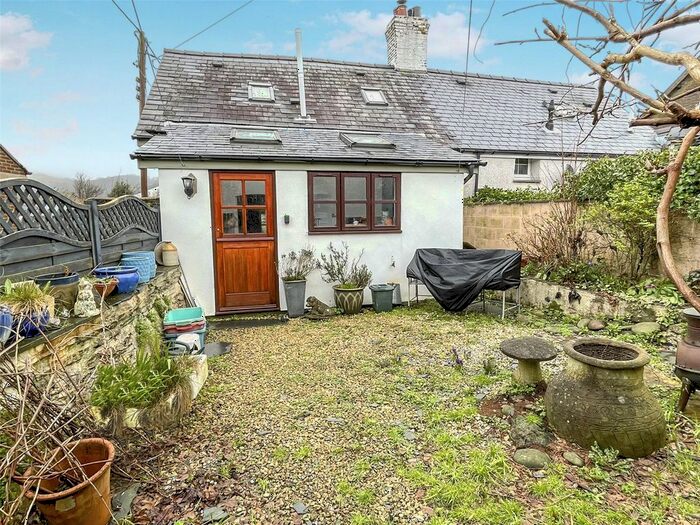
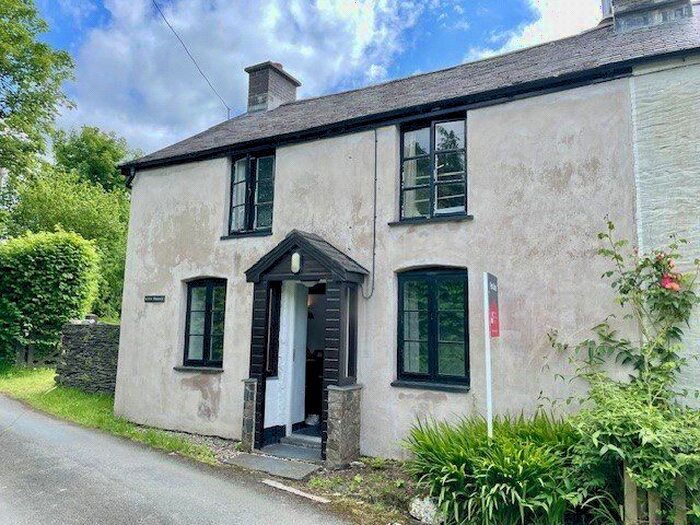
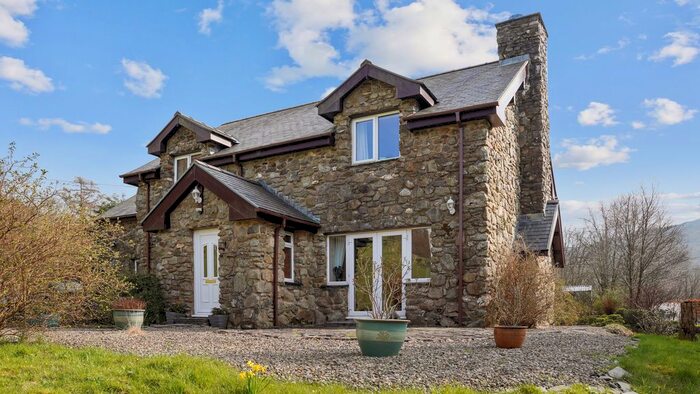
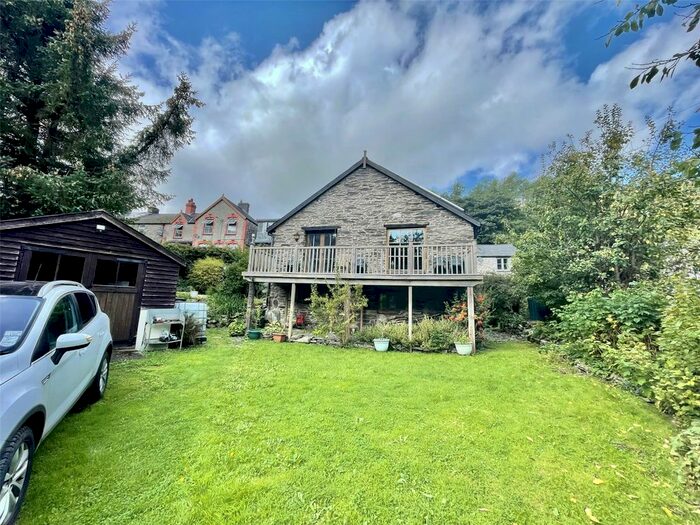
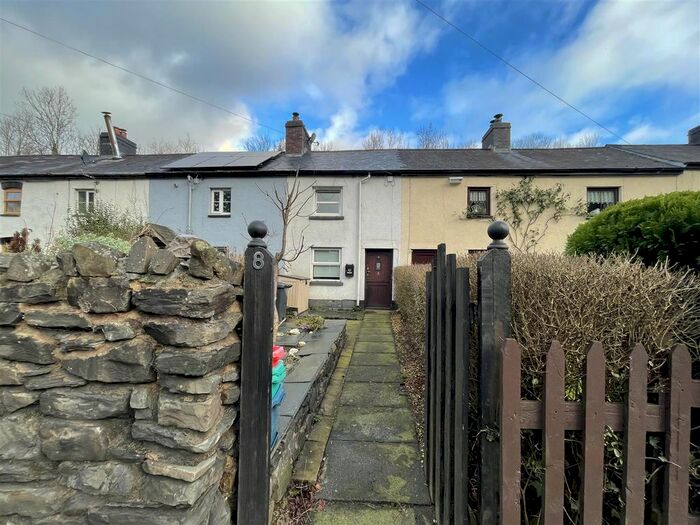
Properties for sale in Machynlleth


Neighbourhoods in Machynlleth
Navigate through our locations to find the location of your next house in Machynlleth, Powys - Powys for sale or to rent.
Transport in Machynlleth
Please see below transportation links in this area:
-
 Machynlleth Station
 -
Dovey Junction Station
-
Penhelig Station
-
Aberdovey Station
-
Morfa Mawddach Station
-
Fairbourne Station
-
Tywyn Station
-
Llwyngwril Station
-
Borth Station
-
Tonfanau Station
- FAQ
- Price Paid By Year
- Property Type Price
Frequently asked questions about Machynlleth
What is the average price for a property for sale in Machynlleth?
The average price for a property for sale in Machynlleth is £223,168. This amount is 15% lower than the average price in Powys - Powys. There are 278 property listings for sale in Machynlleth.
What locations have the most expensive properties for sale in Machynlleth?
The location with the most expensive properties for sale in Machynlleth is Glantwymyn at an average of £266,860.
What locations have the most affordable properties for sale in Machynlleth?
The location with the most affordable properties for sale in Machynlleth is Machynlleth at an average of £184,535.
Which train stations are available in or near Machynlleth?
Some of the train stations available in or near Machynlleth are Machynlleth, Dovey Junction and Penhelig.
Property Price Paid in Machynlleth by Year
The average sold property price by year was:
| Year | Average Sold Price | Price Change |
Sold Properties
|
|---|---|---|---|
| 2024 | £287,500 | 19% |
2 Properties |
| 2023 | £231,796 | -1% |
43 Properties |
| 2022 | £232,996 | 10% |
56 Properties |
| 2021 | £209,706 | 5% |
78 Properties |
| 2020 | £198,625 | 7% |
65 Properties |
| 2019 | £184,068 | 2% |
63 Properties |
| 2018 | £181,263 | 11% |
69 Properties |
| 2017 | £161,433 | -2% |
55 Properties |
| 2016 | £165,250 | 15% |
46 Properties |
| 2015 | £140,097 | -3% |
55 Properties |
| 2014 | £144,454 | -13% |
52 Properties |
| 2013 | £162,558 | 5% |
40 Properties |
| 2012 | £153,870 | 14% |
39 Properties |
| 2011 | £132,158 | -18% |
44 Properties |
| 2010 | £155,817 | -2% |
54 Properties |
| 2009 | £159,457 | 0,4% |
59 Properties |
| 2008 | £158,818 | 3% |
53 Properties |
| 2007 | £153,897 | 2% |
62 Properties |
| 2006 | £151,290 | -1% |
56 Properties |
| 2005 | £153,232 | 31% |
56 Properties |
| 2004 | £105,306 | 8% |
49 Properties |
| 2003 | £96,544 | 24% |
74 Properties |
| 2002 | £73,801 | 16% |
63 Properties |
| 2001 | £62,192 | 22% |
70 Properties |
| 2000 | £48,740 | -4% |
56 Properties |
| 1999 | £50,909 | -3% |
56 Properties |
| 1998 | £52,644 | 24% |
40 Properties |
| 1997 | £40,241 | -11% |
40 Properties |
| 1996 | £44,632 | 2% |
35 Properties |
| 1995 | £43,615 | - |
26 Properties |
Property Price per Property Type in Machynlleth
Here you can find historic sold price data in order to help with your property search.
The average Property Paid Price for specific property types in the last three years are:
| Property Type | Average Sold Price | Sold Properties |
|---|---|---|
| Semi Detached House | £189,432.00 | 37 Semi Detached Houses |
| Terraced House | £161,680.00 | 75 Terraced Houses |
| Detached House | £313,744.00 | 66 Detached Houses |
| Flat | £105,000.00 | 1 Flat |