
Houses for sale & to rent in Newtown, Powys - Powys
House Prices in Newtown
Properties in Newtown have an average house price of £210,438.00 and had 626 Property Transactions within the last 3 years.¹
Newtown is an area in Powys - Powys with 6,929 households², where the most expensive property was sold for £865,000.00.
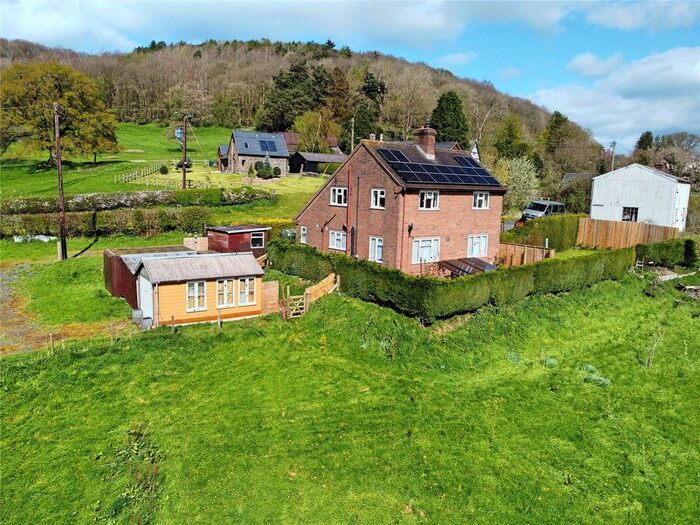
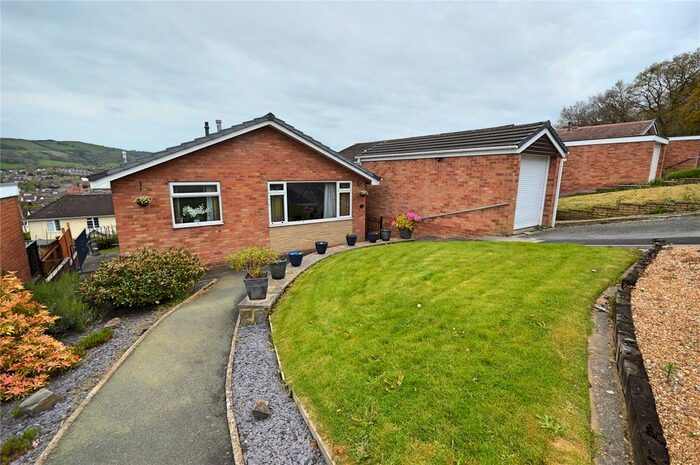
Properties for sale in Newtown


Neighbourhoods in Newtown
Navigate through our locations to find the location of your next house in Newtown, Powys - Powys for sale or to rent.
Transport in Newtown
Please see below transportation links in this area:
-
 Newtown Station
 -
Caersws Station
-
Welshpool Station
-
Llanbister Road Station
-
Llangynllo Station
-
Knucklas Station
- FAQ
- Price Paid By Year
- Property Type Price
Frequently asked questions about Newtown
What is the average price for a property for sale in Newtown?
The average price for a property for sale in Newtown is £210,438. This amount is 21% lower than the average price in Powys - Powys. There are 1,065 property listings for sale in Newtown.
What locations have the most expensive properties for sale in Newtown?
The locations with the most expensive properties for sale in Newtown are Rhiwcynon at an average of £270,205, Kerry at an average of £261,258 and Dolforwyn at an average of £253,164.
What locations have the most affordable properties for sale in Newtown?
The locations with the most affordable properties for sale in Newtown are Newtown Central at an average of £147,448, Newtown South at an average of £151,430 and Newtown East at an average of £170,556.
Which train stations are available in or near Newtown?
Some of the train stations available in or near Newtown are Newtown, Caersws and Welshpool.
Property Price Paid in Newtown by Year
The average sold property price by year was:
| Year | Average Sold Price | Price Change |
Sold Properties
|
|---|---|---|---|
| 2024 | £221,688 | 2% |
21 Properties |
| 2023 | £217,947 | 2% |
149 Properties |
| 2022 | £213,593 | 5% |
198 Properties |
| 2021 | £202,764 | 7% |
258 Properties |
| 2020 | £188,982 | 8% |
184 Properties |
| 2019 | £174,038 | 4% |
211 Properties |
| 2018 | £167,364 | 7% |
200 Properties |
| 2017 | £155,538 | -1% |
213 Properties |
| 2016 | £157,817 | 1% |
195 Properties |
| 2015 | £155,974 | 5% |
210 Properties |
| 2014 | £148,227 | 1% |
209 Properties |
| 2013 | £146,959 | 5% |
151 Properties |
| 2012 | £140,174 | - |
138 Properties |
| 2011 | £140,139 | -6% |
142 Properties |
| 2010 | £149,131 | 8% |
144 Properties |
| 2009 | £137,209 | -1% |
150 Properties |
| 2008 | £138,314 | -21% |
142 Properties |
| 2007 | £167,131 | 13% |
248 Properties |
| 2006 | £145,353 | 5% |
288 Properties |
| 2005 | £137,845 | 9% |
206 Properties |
| 2004 | £125,698 | 20% |
266 Properties |
| 2003 | £100,923 | 23% |
311 Properties |
| 2002 | £77,505 | 16% |
247 Properties |
| 2001 | £64,752 | 4% |
257 Properties |
| 2000 | £61,919 | 9% |
236 Properties |
| 1999 | £56,589 | 6% |
195 Properties |
| 1998 | £53,007 | -2% |
194 Properties |
| 1997 | £54,002 | -3% |
228 Properties |
| 1996 | £55,401 | 5% |
185 Properties |
| 1995 | £52,848 | - |
170 Properties |
Property Price per Property Type in Newtown
Here you can find historic sold price data in order to help with your property search.
The average Property Paid Price for specific property types in the last three years are:
| Property Type | Average Sold Price | Sold Properties |
|---|---|---|
| Semi Detached House | £185,921.00 | 144 Semi Detached Houses |
| Terraced House | £138,270.00 | 208 Terraced Houses |
| Detached House | £294,742.00 | 250 Detached Houses |
| Flat | £104,831.00 | 24 Flats |