
Houses for sale & to rent in Falmouth, Cornwall
House Prices in Falmouth
Properties in Falmouth have an average house price of £429,848.00 and had 1,746 Property Transactions within the last 3 years.¹
Falmouth is an area in Cornwall with 12,624 households², where the most expensive property was sold for £3,900,000.00.
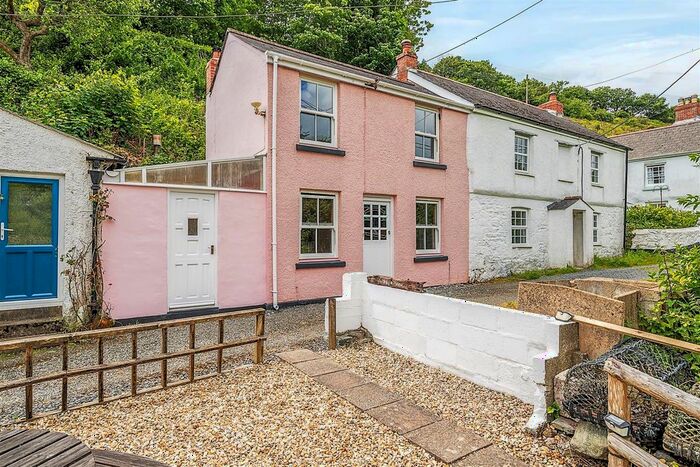
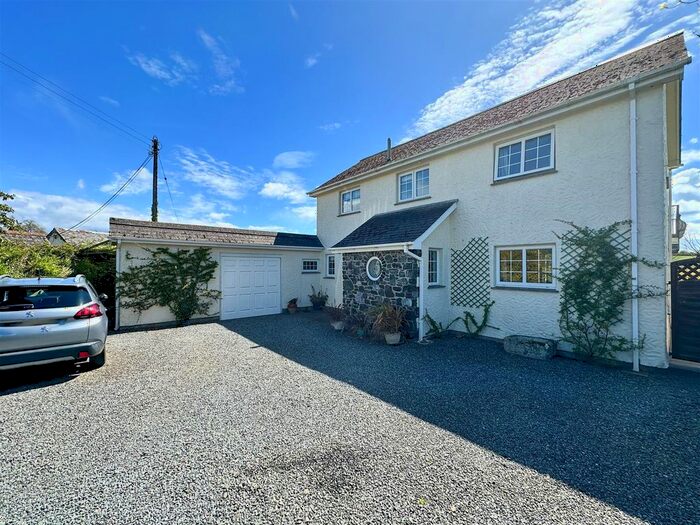
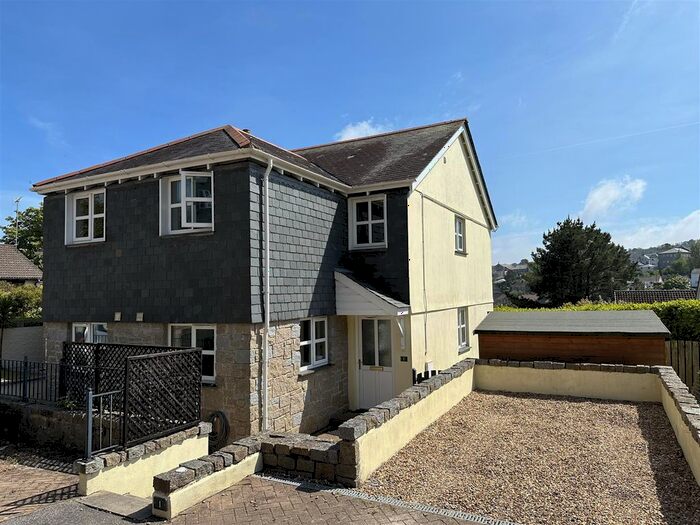
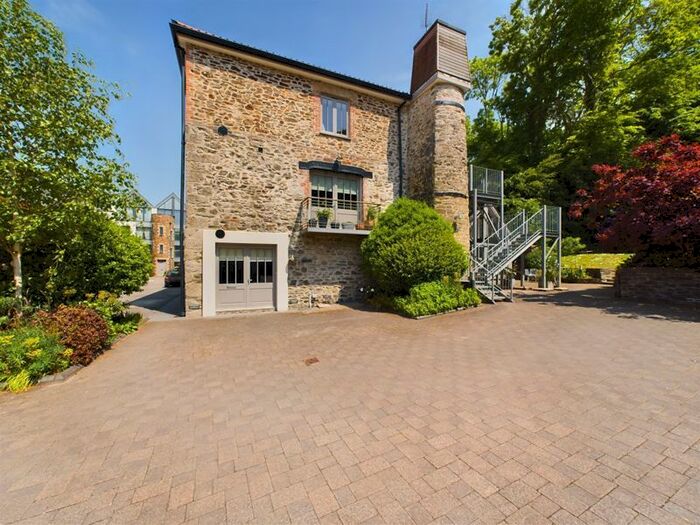
Properties for sale in Falmouth


Neighbourhoods in Falmouth
Navigate through our locations to find the location of your next house in Falmouth, Cornwall for sale or to rent.
Transport in Falmouth
Please see below transportation links in this area:

- FAQ
- Price Paid By Year
- Property Type Price
Frequently asked questions about Falmouth
What is the average price for a property for sale in Falmouth?
The average price for a property for sale in Falmouth is £429,848. This amount is 22% higher than the average price in Cornwall. There are 4,218 property listings for sale in Falmouth.
What locations have the most expensive properties for sale in Falmouth?
The locations with the most expensive properties for sale in Falmouth are Mabe, Perranarworthal And St Gluvias at an average of £2,150,000, Penryn East And Mylor at an average of £617,645 and Constantine, Mawnan And Budock at an average of £521,012.
What locations have the most affordable properties for sale in Falmouth?
The locations with the most affordable properties for sale in Falmouth are Falmouth Trescobeas at an average of £317,217, Falmouth Boslowick at an average of £337,995 and Falmouth Smithick at an average of £357,027.
Which train stations are available in or near Falmouth?
Some of the train stations available in or near Falmouth are Penmere, Falmouth Town and Falmouth Docks.
Property Price Paid in Falmouth by Year
The average sold property price by year was:
| Year | Average Sold Price | Price Change |
Sold Properties
|
|---|---|---|---|
| 2024 | £434,107 | -1% |
36 Properties |
| 2023 | £438,091 | -3% |
403 Properties |
| 2022 | £453,223 | 10% |
540 Properties |
| 2021 | £408,861 | 6% |
767 Properties |
| 2020 | £386,007 | 11% |
610 Properties |
| 2019 | £342,453 | 1% |
668 Properties |
| 2018 | £339,049 | 1% |
606 Properties |
| 2017 | £334,313 | 10% |
629 Properties |
| 2016 | £301,844 | 3% |
670 Properties |
| 2015 | £291,910 | 5% |
682 Properties |
| 2014 | £278,568 | 5% |
671 Properties |
| 2013 | £263,590 | -1% |
554 Properties |
| 2012 | £266,357 | -0,2% |
541 Properties |
| 2011 | £266,919 | 1% |
520 Properties |
| 2010 | £264,272 | 2% |
449 Properties |
| 2009 | £259,510 | -6% |
508 Properties |
| 2008 | £274,078 | -1% |
388 Properties |
| 2007 | £277,205 | 11% |
648 Properties |
| 2006 | £247,506 | 1% |
741 Properties |
| 2005 | £246,241 | 7% |
533 Properties |
| 2004 | £228,894 | 11% |
604 Properties |
| 2003 | £203,205 | 20% |
670 Properties |
| 2002 | £161,826 | 27% |
738 Properties |
| 2001 | £117,398 | 7% |
768 Properties |
| 2000 | £109,715 | 15% |
742 Properties |
| 1999 | £93,471 | 9% |
793 Properties |
| 1998 | £85,129 | 12% |
683 Properties |
| 1997 | £74,738 | 6% |
793 Properties |
| 1996 | £69,950 | 6% |
631 Properties |
| 1995 | £65,955 | - |
503 Properties |
Property Price per Property Type in Falmouth
Here you can find historic sold price data in order to help with your property search.
The average Property Paid Price for specific property types in the last three years are:
| Property Type | Average Sold Price | Sold Properties |
|---|---|---|
| Terraced House | £345,785.00 | 530 Terraced Houses |
| Flat | £338,663.00 | 417 Flats |
| Semi Detached House | £367,665.00 | 344 Semi Detached Houses |
| Detached House | £658,351.00 | 455 Detached Houses |