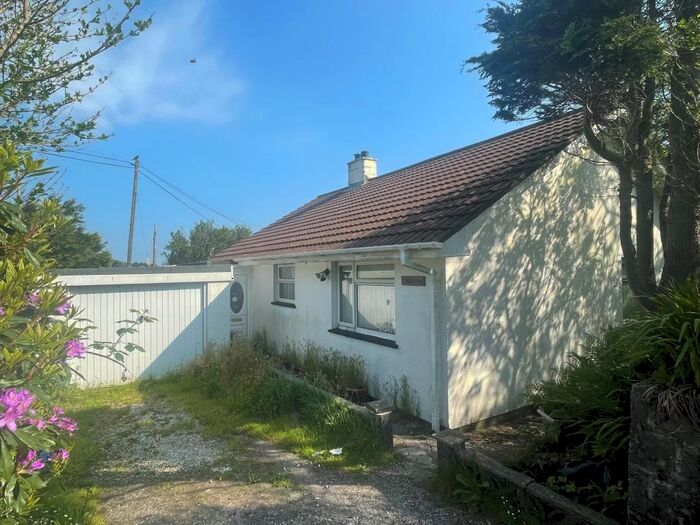
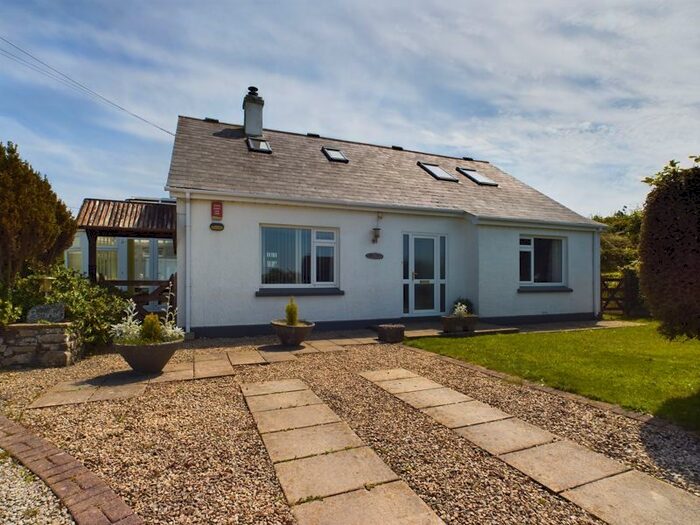
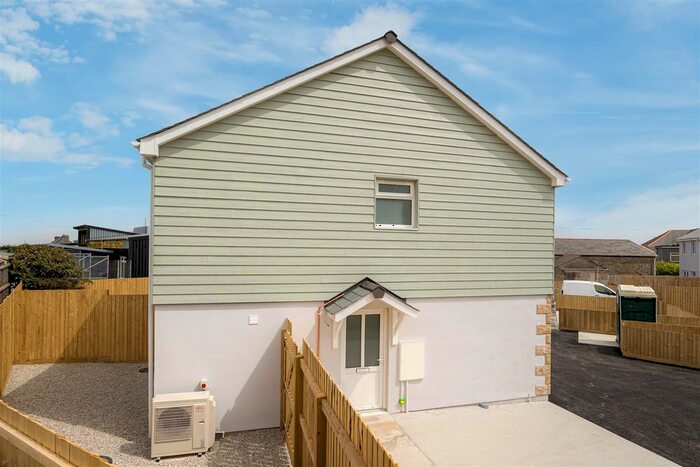
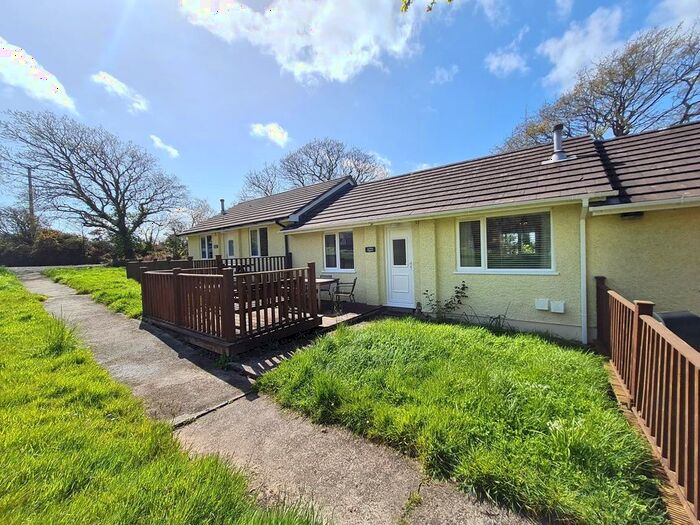
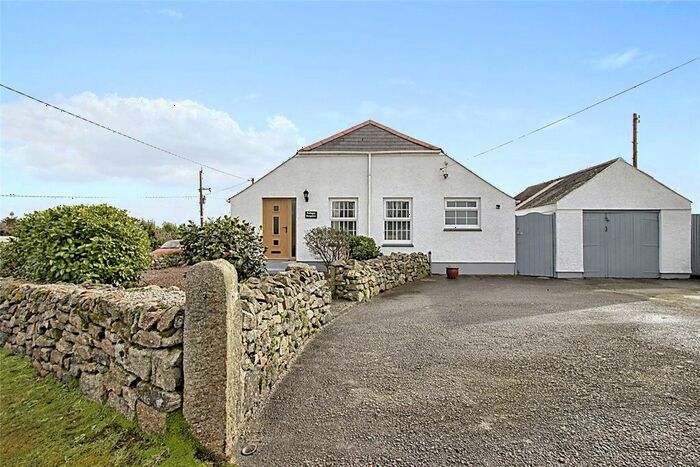
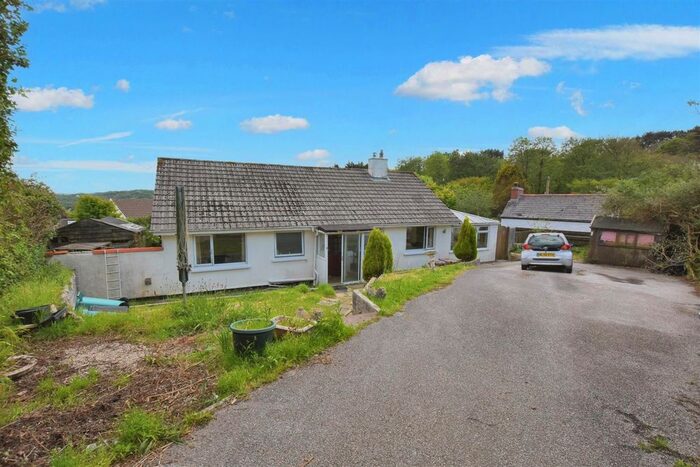
Houses for sale & to rent in Helston, Cornwall
House Prices in Helston
Properties in Helston have an average house price of £368,582.00 and had 1,323 Property Transactions within the last 3 years.¹
Helston is an area in Cornwall with 12,272 households², where the most expensive property was sold for £2,400,000.00.
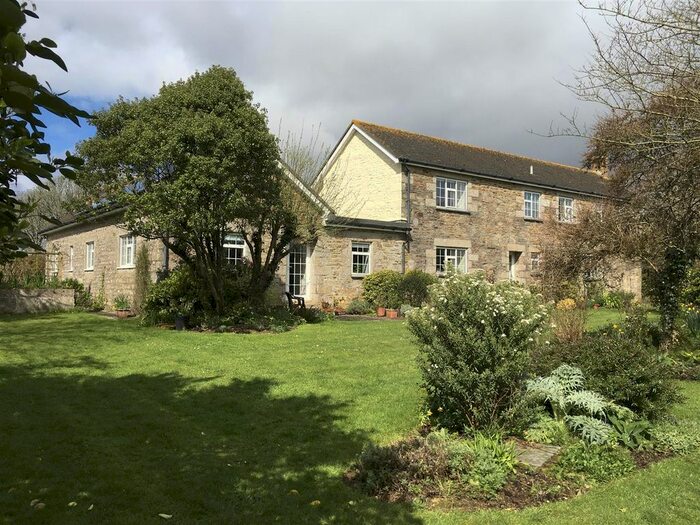
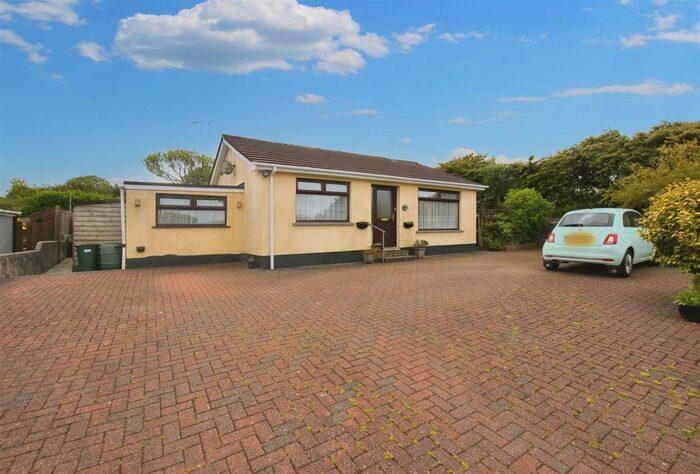
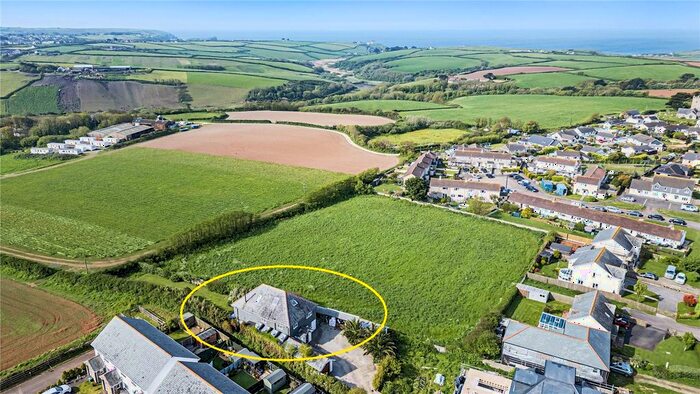
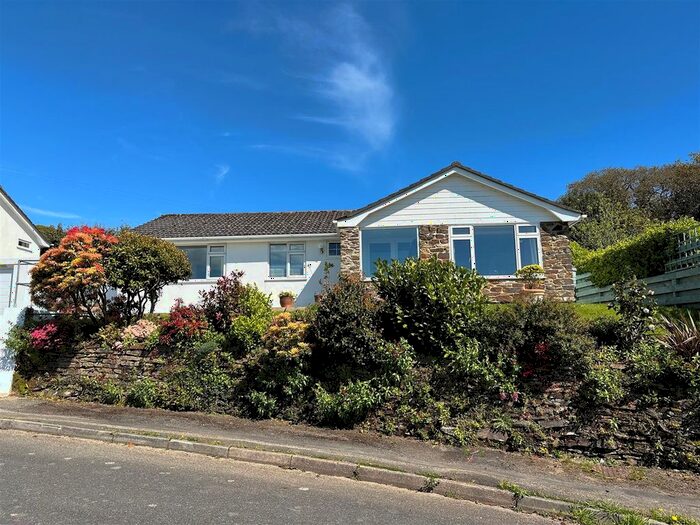
Properties for sale in Helston
Neighbourhoods in Helston
Navigate through our locations to find the location of your next house in Helston, Cornwall for sale or to rent.
Transport in Helston
Please see below transportation links in this area:
- FAQ
- Price Paid By Year
- Property Type Price
Frequently asked questions about Helston
What is the average price for a property for sale in Helston?
The average price for a property for sale in Helston is £368,582. This amount is 6% higher than the average price in Cornwall. There are more than 10,000 property listings for sale in Helston.
What locations have the most expensive properties for sale in Helston?
The locations with the most expensive properties for sale in Helston are St Keverne And Meneage at an average of £496,707, Breage, Germoe And Sithney at an average of £452,617 and Mullion And Grade-ruan at an average of £419,094.
What locations have the most affordable properties for sale in Helston?
The locations with the most affordable properties for sale in Helston are Helston South at an average of £256,409, Helston North at an average of £290,732 and Crowan And Wendron at an average of £359,107.
Which train stations are available in or near Helston?
Some of the train stations available in or near Helston are Penryn, Penmere and Camborne.
Property Price Paid in Helston by Year
The average sold property price by year was:
| Year | Average Sold Price | Price Change |
Sold Properties
|
|---|---|---|---|
| 2024 | £343,669 | -8% |
30 Properties |
| 2023 | £372,089 | -5% |
284 Properties |
| 2022 | £389,461 | 9% |
416 Properties |
| 2021 | £353,516 | 16% |
593 Properties |
| 2020 | £295,434 | 8% |
448 Properties |
| 2019 | £270,876 | 2% |
515 Properties |
| 2018 | £265,731 | 2% |
467 Properties |
| 2017 | £259,978 | -3% |
572 Properties |
| 2016 | £268,369 | 11% |
515 Properties |
| 2015 | £240,081 | 1% |
503 Properties |
| 2014 | £238,678 | 6% |
563 Properties |
| 2013 | £224,545 | -2% |
438 Properties |
| 2012 | £228,866 | 9% |
388 Properties |
| 2011 | £208,220 | -12% |
339 Properties |
| 2010 | £232,524 | 6% |
374 Properties |
| 2009 | £218,820 | -7% |
426 Properties |
| 2008 | £234,789 | -3% |
354 Properties |
| 2007 | £241,436 | 5% |
610 Properties |
| 2006 | £228,484 | 4% |
683 Properties |
| 2005 | £219,360 | 6% |
412 Properties |
| 2004 | £206,535 | 15% |
510 Properties |
| 2003 | £175,874 | 27% |
552 Properties |
| 2002 | £129,030 | 21% |
696 Properties |
| 2001 | £101,600 | 10% |
689 Properties |
| 2000 | £91,886 | 11% |
649 Properties |
| 1999 | £82,056 | 16% |
631 Properties |
| 1998 | £69,029 | -4% |
660 Properties |
| 1997 | £72,052 | 13% |
623 Properties |
| 1996 | £62,447 | 5% |
545 Properties |
| 1995 | £59,273 | - |
390 Properties |
Property Price per Property Type in Helston
Here you can find historic sold price data in order to help with your property search.
The average Property Paid Price for specific property types in the last three years are:
| Property Type | Average Sold Price | Sold Properties |
|---|---|---|
| Terraced House | £250,482.00 | 338 Terraced Houses |
| Flat | £161,697.00 | 75 Flats |
| Semi Detached House | £296,374.00 | 259 Semi Detached Houses |
| Detached House | £482,463.00 | 651 Detached Houses |


