
Houses for sale & to rent in Newport, Isle of Wight
House Prices in Newport
Properties in Newport have an average house price of £256,021.00 and had 1,616 Property Transactions within the last 3 years.¹
Newport is an area in Isle of Wight with 12,224 households², where the most expensive property was sold for £1,250,000.00.
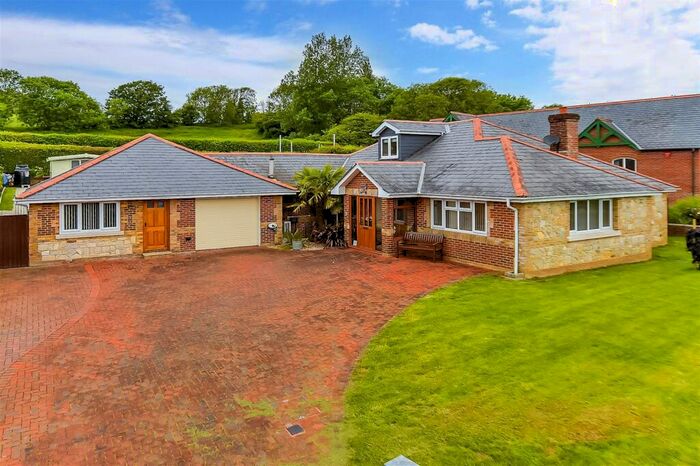
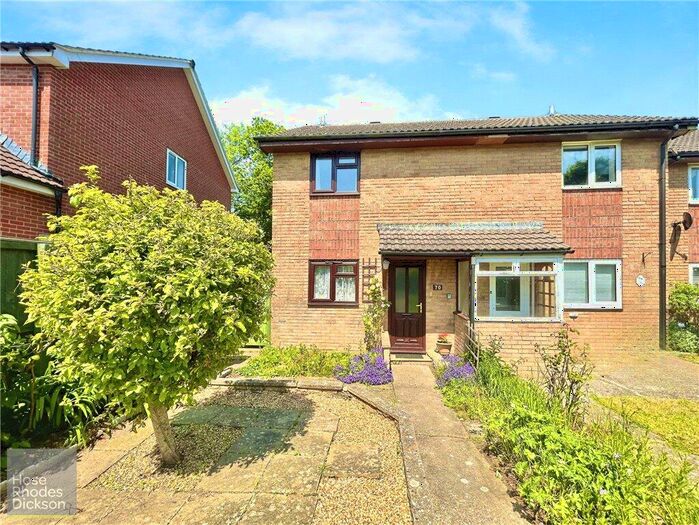
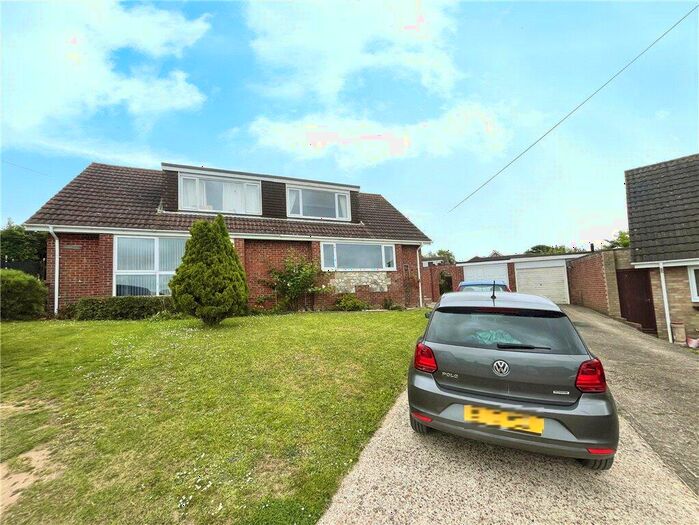
Properties for sale in Newport


Neighbourhoods in Newport
Navigate through our locations to find the location of your next house in Newport, Isle of Wight for sale or to rent.
Transport in Newport
Please see below transportation links in this area:
-
 Sandown Station
 -
Shanklin Station
-
Smallbrook Junction Station
-
Lake Station
-
Ryde St.John's Road Station
-
Ryde Esplanade Station
-
Ryde Pier Head Station
-
Brading Station
- FAQ
- Price Paid By Year
- Property Type Price
Frequently asked questions about Newport
What is the average price for a property for sale in Newport?
The average price for a property for sale in Newport is £256,021. This amount is 16% lower than the average price in Isle of Wight. There are 8,262 property listings for sale in Newport.
What locations have the most expensive properties for sale in Newport?
The locations with the most expensive properties for sale in Newport are Central Wight at an average of £429,281, West Wight at an average of £400,274 and Arreton And Newchurch at an average of £329,997.
What locations have the most affordable properties for sale in Newport?
The locations with the most affordable properties for sale in Newport are Newport Central at an average of £165,006, Newport East at an average of £215,109 and Parkhurst at an average of £235,203.
Which train stations are available in or near Newport?
Some of the train stations available in or near Newport are Sandown, Shanklin and Smallbrook Junction.
Property Price Paid in Newport by Year
The average sold property price by year was:
| Year | Average Sold Price | Price Change |
Sold Properties
|
|---|---|---|---|
| 2024 | £265,088 | 4% |
34 Properties |
| 2023 | £255,785 | -2% |
331 Properties |
| 2022 | £260,689 | 3% |
555 Properties |
| 2021 | £251,968 | 7% |
696 Properties |
| 2020 | £233,608 | 7% |
504 Properties |
| 2019 | £217,237 | 5% |
533 Properties |
| 2018 | £207,262 | -1% |
514 Properties |
| 2017 | £209,275 | -0,1% |
586 Properties |
| 2016 | £209,475 | 8% |
614 Properties |
| 2015 | £191,960 | 2% |
608 Properties |
| 2014 | £187,212 | 3% |
586 Properties |
| 2013 | £180,951 | 7% |
513 Properties |
| 2012 | £169,133 | -11% |
409 Properties |
| 2011 | £187,002 | -1% |
365 Properties |
| 2010 | £189,112 | 8% |
377 Properties |
| 2009 | £173,105 | -17% |
377 Properties |
| 2008 | £201,804 | 9% |
432 Properties |
| 2007 | £182,647 | 2% |
676 Properties |
| 2006 | £178,177 | 5% |
723 Properties |
| 2005 | £168,487 | 0,4% |
617 Properties |
| 2004 | £167,740 | 15% |
715 Properties |
| 2003 | £142,321 | 11% |
731 Properties |
| 2002 | £126,470 | 18% |
710 Properties |
| 2001 | £103,641 | 16% |
722 Properties |
| 2000 | £86,607 | 18% |
668 Properties |
| 1999 | £70,779 | 10% |
750 Properties |
| 1998 | £64,031 | 11% |
660 Properties |
| 1997 | £56,926 | 7% |
684 Properties |
| 1996 | £53,223 | -1% |
614 Properties |
| 1995 | £53,950 | - |
520 Properties |
Property Price per Property Type in Newport
Here you can find historic sold price data in order to help with your property search.
The average Property Paid Price for specific property types in the last three years are:
| Property Type | Average Sold Price | Sold Properties |
|---|---|---|
| Terraced House | £209,467.00 | 532 Terraced Houses |
| Flat | £131,779.00 | 250 Flats |
| Semi Detached House | £252,596.00 | 392 Semi Detached Houses |
| Detached House | £385,364.00 | 442 Detached Houses |