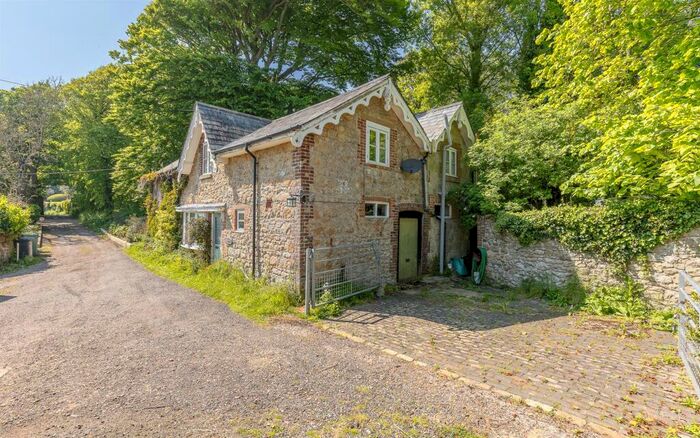
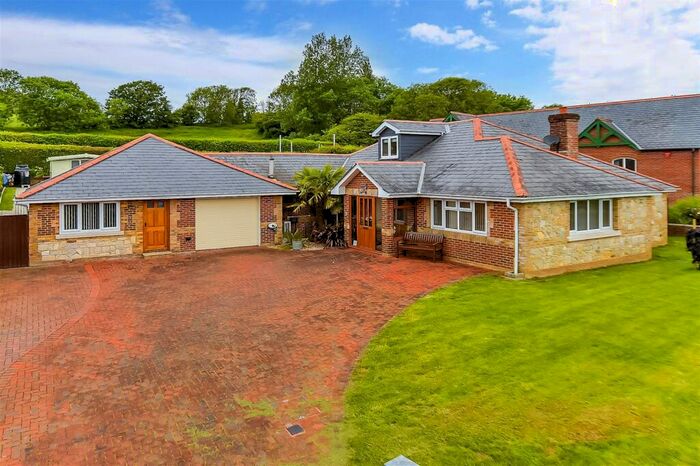
Houses for sale & to rent in Ventnor, Isle of Wight
House Prices in Ventnor
Properties in Ventnor have an average house price of £345,596.00 and had 747 Property Transactions within the last 3 years.¹
Ventnor is an area in Isle of Wight with 5,840 households², where the most expensive property was sold for £2,250,000.00.
Properties for sale in Ventnor
Neighbourhoods in Ventnor
Navigate through our locations to find the location of your next house in Ventnor, Isle of Wight for sale or to rent.
Transport in Ventnor
Please see below transportation links in this area:
-
Shanklin Station
-
Lake Station
-
Sandown Station
-
Brading Station
-
Smallbrook Junction Station
-
Ryde St.John's Road Station
-
Ryde Esplanade Station
-
Ryde Pier Head Station
- FAQ
- Price Paid By Year
- Property Type Price
Frequently asked questions about Ventnor
What is the average price for a property for sale in Ventnor?
The average price for a property for sale in Ventnor is £345,596. This amount is 14% higher than the average price in Isle of Wight. There are 5,618 property listings for sale in Ventnor.
What locations have the most expensive properties for sale in Ventnor?
The locations with the most expensive properties for sale in Ventnor are Arreton And Newchurch at an average of £597,500, Chale, Niton And Whitwell at an average of £437,498 and Central Wight at an average of £374,969.
What locations have the most affordable properties for sale in Ventnor?
The locations with the most affordable properties for sale in Ventnor are Ventnor East at an average of £282,085, Godshill And Wroxall at an average of £334,948 and Ventnor West at an average of £361,225.
Which train stations are available in or near Ventnor?
Some of the train stations available in or near Ventnor are Shanklin, Lake and Sandown.
Property Price Paid in Ventnor by Year
The average sold property price by year was:
| Year | Average Sold Price | Price Change |
Sold Properties
|
|---|---|---|---|
| 2024 | £276,026 | -33% |
19 Properties |
| 2023 | £367,355 | 6% |
147 Properties |
| 2022 | £346,055 | 2% |
253 Properties |
| 2021 | £339,521 | 15% |
328 Properties |
| 2020 | £288,970 | 12% |
263 Properties |
| 2019 | £254,101 | -4% |
249 Properties |
| 2018 | £263,331 | 9% |
260 Properties |
| 2017 | £239,911 | 1% |
256 Properties |
| 2016 | £237,416 | 11% |
311 Properties |
| 2015 | £211,709 | 1% |
299 Properties |
| 2014 | £209,615 | 1% |
275 Properties |
| 2013 | £207,801 | -2% |
263 Properties |
| 2012 | £212,864 | -3% |
189 Properties |
| 2011 | £219,945 | -2% |
214 Properties |
| 2010 | £224,275 | 4% |
211 Properties |
| 2009 | £214,730 | 0,5% |
202 Properties |
| 2008 | £213,686 | -1% |
186 Properties |
| 2007 | £215,976 | -3% |
390 Properties |
| 2006 | £222,016 | 14% |
399 Properties |
| 2005 | £190,110 | 2% |
286 Properties |
| 2004 | £186,252 | 17% |
354 Properties |
| 2003 | £155,023 | 13% |
377 Properties |
| 2002 | £134,694 | 22% |
395 Properties |
| 2001 | £105,582 | 10% |
389 Properties |
| 2000 | £95,058 | 11% |
379 Properties |
| 1999 | £84,257 | 15% |
426 Properties |
| 1998 | £71,354 | 11% |
370 Properties |
| 1997 | £63,303 | 7% |
387 Properties |
| 1996 | £58,983 | 4% |
334 Properties |
| 1995 | £56,892 | - |
238 Properties |
Property Price per Property Type in Ventnor
Here you can find historic sold price data in order to help with your property search.
The average Property Paid Price for specific property types in the last three years are:
| Property Type | Average Sold Price | Sold Properties |
|---|---|---|
| Semi Detached House | £312,321.00 | 163 Semi Detached Houses |
| Terraced House | £251,898.00 | 110 Terraced Houses |
| Detached House | £484,072.00 | 303 Detached Houses |
| Flat | £192,220.00 | 171 Flats |


