
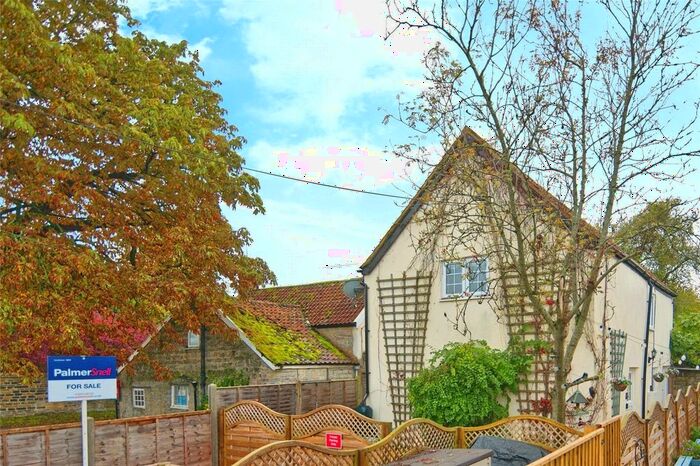
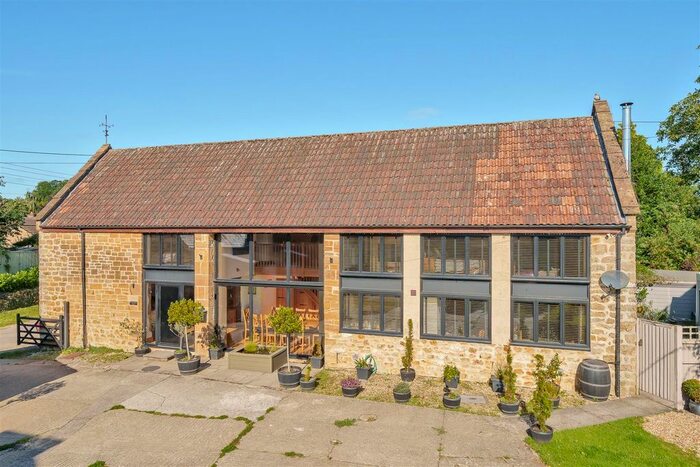
Houses for sale & to rent in Ilminster, Somerset
House Prices in Ilminster
Properties in Ilminster have an average house price of £344,584.00 and had 683 Property Transactions within the last 3 years.¹
Ilminster is an area in Somerset with 5,160 households², where the most expensive property was sold for £1,350,000.00.
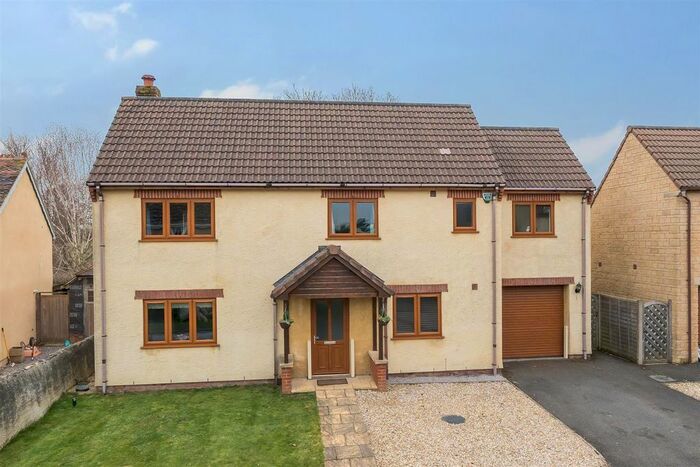
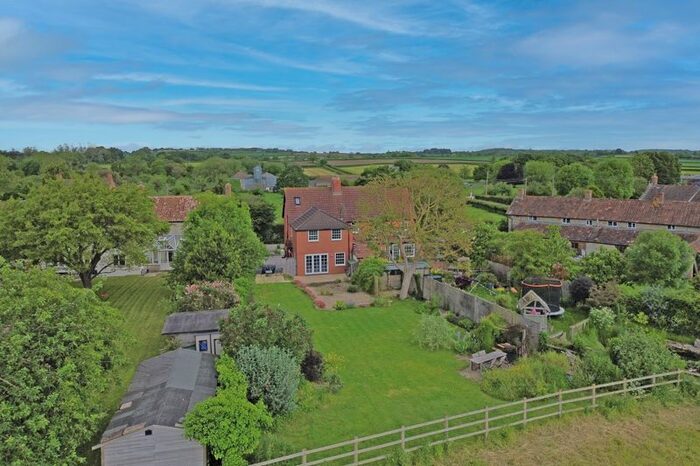
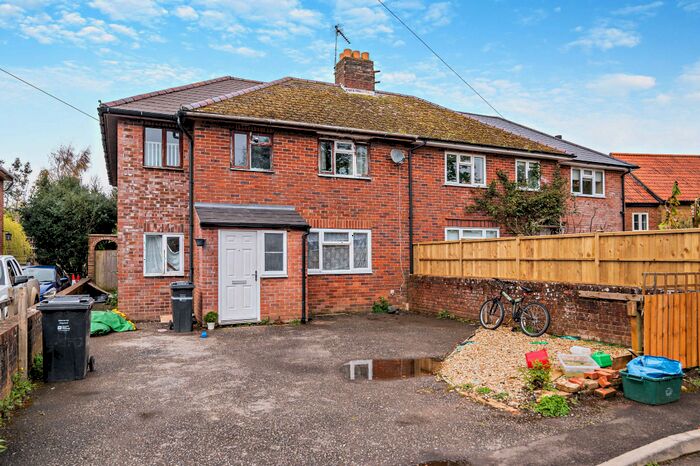
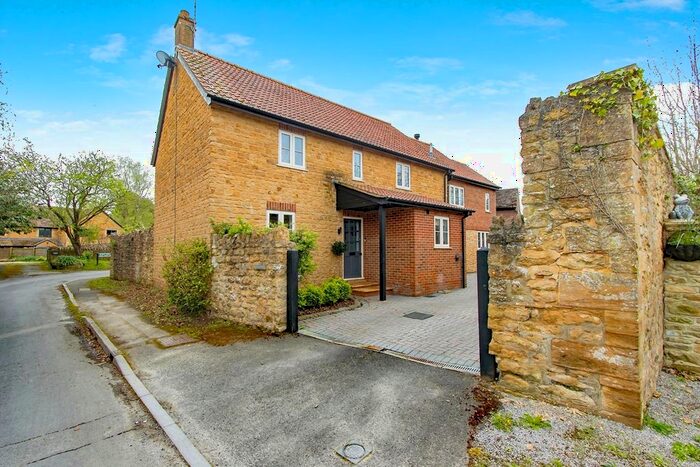
Properties for sale in Ilminster


Neighbourhoods in Ilminster
Navigate through our locations to find the location of your next house in Ilminster, Somerset for sale or to rent.
Transport in Ilminster
Please see below transportation links in this area:
-
 Crewkerne Station
 -
Taunton Station
-
Axminster Station
-
Yeovil Pen Mill Station
-
Yeovil Junction Station
-
Bridgwater Station
-
Thornford Station
- FAQ
- Price Paid By Year
- Property Type Price
Frequently asked questions about Ilminster
What is the average price for a property for sale in Ilminster?
The average price for a property for sale in Ilminster is £344,584. This amount is 7% higher than the average price in Somerset. There are 2,262 property listings for sale in Ilminster.
What locations have the most expensive properties for sale in Ilminster?
The locations with the most expensive properties for sale in Ilminster are Windwhistle at an average of £487,147, Burrow Hill at an average of £464,424 and Neroche at an average of £458,547.
What locations have the most affordable properties for sale in Ilminster?
The locations with the most affordable properties for sale in Ilminster are Ilminster at an average of £282,280, Islemoor at an average of £307,122 and South Petherton at an average of £380,830.
Which train stations are available in or near Ilminster?
Some of the train stations available in or near Ilminster are Crewkerne, Taunton and Axminster.
Property Price Paid in Ilminster by Year
The average sold property price by year was:
| Year | Average Sold Price | Price Change |
Sold Properties
|
|---|---|---|---|
| 2024 | £275,484 | -27% |
11 Properties |
| 2023 | £348,964 | 1% |
151 Properties |
| 2022 | £344,359 | -0,2% |
222 Properties |
| 2021 | £345,080 | 7% |
299 Properties |
| 2020 | £320,775 | 13% |
196 Properties |
| 2019 | £277,540 | -1% |
259 Properties |
| 2018 | £279,633 | 5% |
233 Properties |
| 2017 | £264,448 | 9% |
274 Properties |
| 2016 | £240,191 | -4% |
259 Properties |
| 2015 | £249,003 | 4% |
269 Properties |
| 2014 | £240,137 | 6% |
256 Properties |
| 2013 | £226,461 | -1% |
173 Properties |
| 2012 | £227,928 | -3% |
163 Properties |
| 2011 | £234,198 | 1% |
141 Properties |
| 2010 | £231,753 | 10% |
171 Properties |
| 2009 | £209,179 | -15% |
168 Properties |
| 2008 | £240,986 | -3% |
162 Properties |
| 2007 | £248,200 | 11% |
279 Properties |
| 2006 | £220,656 | 6% |
289 Properties |
| 2005 | £206,337 | -0,1% |
269 Properties |
| 2004 | £206,599 | 15% |
395 Properties |
| 2003 | £176,160 | 20% |
304 Properties |
| 2002 | £140,345 | 12% |
393 Properties |
| 2001 | £123,847 | 7% |
357 Properties |
| 2000 | £115,739 | 16% |
191 Properties |
| 1999 | £97,095 | 19% |
256 Properties |
| 1998 | £78,955 | - |
234 Properties |
| 1997 | £78,981 | 10% |
279 Properties |
| 1996 | £71,402 | -15% |
230 Properties |
| 1995 | £81,792 | - |
158 Properties |
Property Price per Property Type in Ilminster
Here you can find historic sold price data in order to help with your property search.
The average Property Paid Price for specific property types in the last three years are:
| Property Type | Average Sold Price | Sold Properties |
|---|---|---|
| Semi Detached House | £307,337.00 | 180 Semi Detached Houses |
| Terraced House | £236,107.00 | 209 Terraced Houses |
| Detached House | £485,169.00 | 256 Detached Houses |
| Flat | £170,539.00 | 38 Flats |