
Houses for sale & to rent in Minehead, Somerset
House Prices in Minehead
Properties in Minehead have an average house price of £313,143.00 and had 1,121 Property Transactions within the last 3 years.¹
Minehead is an area in Somerset with 8,382 households², where the most expensive property was sold for £1,650,000.00.
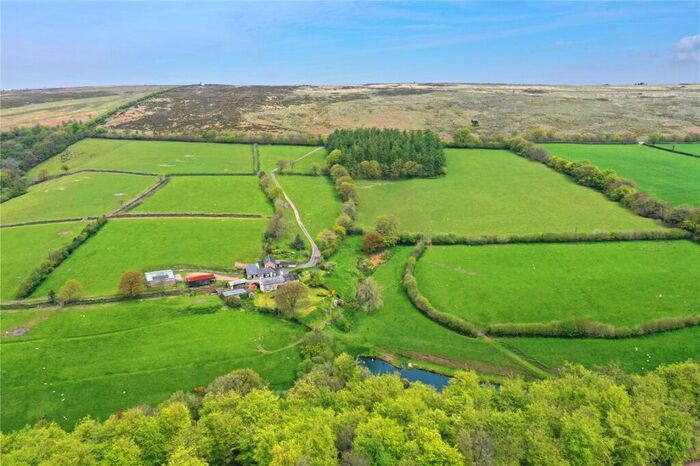
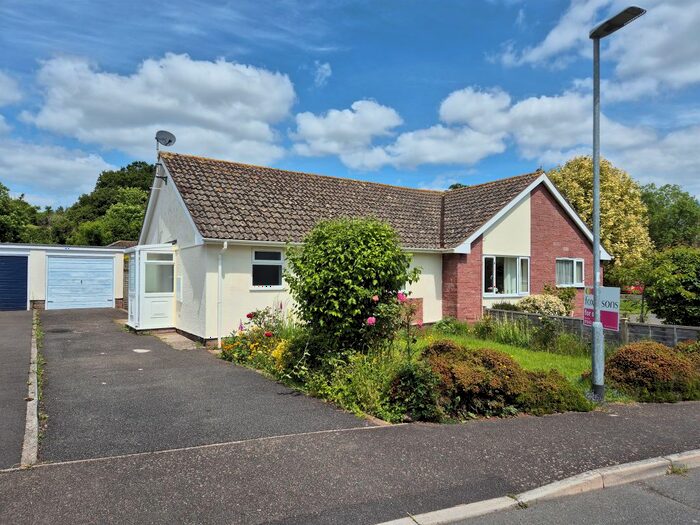
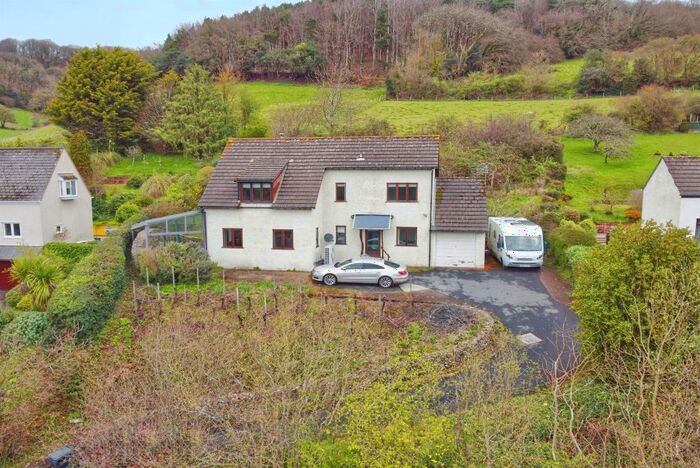
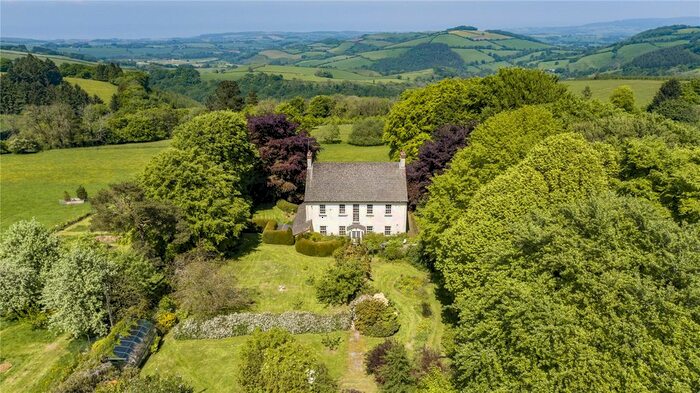
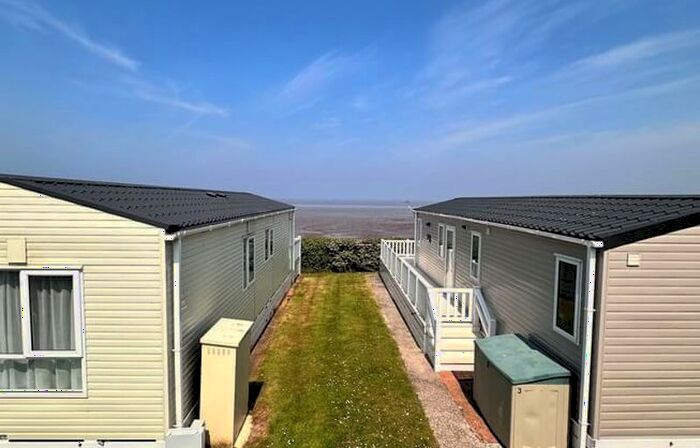
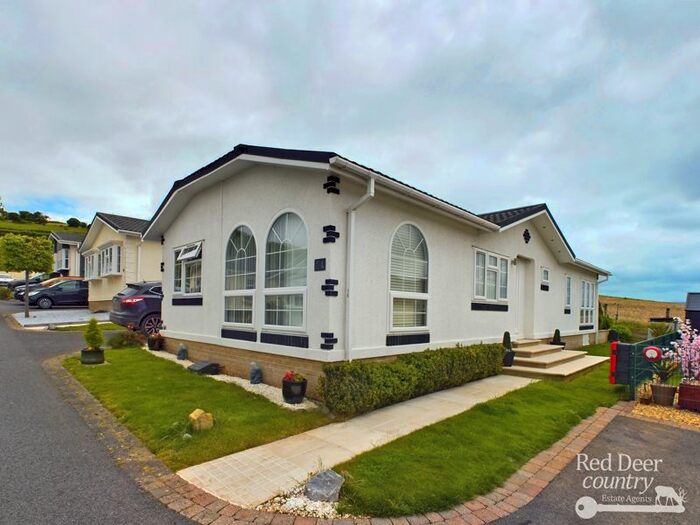
Properties for sale in Minehead


Neighbourhoods in Minehead
Navigate through our locations to find the location of your next house in Minehead, Somerset for sale or to rent.
- Alcombe
- Brendon Hills
- Carhampton And Withycombe
- Dulverton And District
- Dunster And Timberscombe
- Greater Exmoor
- Minehead Central
- Minehead North
- Minehead South
- Old Cleeve
- Porlock And District
- Porlock & District
- Old Cleeve & District
- Exmoor
- Dulverton & District
- Periton & Woodcombe
- Minehead
- Dunster
- Dulverton & Exmoor
Transport in Minehead
Please see below transportation links in this area:
-
 Llantwit Major Station
 -
Rhoose (Cardiff Int Airpt) Station
-
Barry Station
-
Barry Island Station
-
Barry Docks Station
-
Tiverton Parkway Station
-
Cadoxton Station
- FAQ
- Price Paid By Year
- Property Type Price
Frequently asked questions about Minehead
What is the average price for a property for sale in Minehead?
The average price for a property for sale in Minehead is £313,143. This amount is 2% lower than the average price in Somerset. There are 1,599 property listings for sale in Minehead.
What locations have the most expensive properties for sale in Minehead?
The locations with the most expensive properties for sale in Minehead are Exmoor at an average of £644,400, Porlock & District at an average of £586,000 and Porlock And District at an average of £435,017.
What locations have the most affordable properties for sale in Minehead?
The locations with the most affordable properties for sale in Minehead are Minehead Central at an average of £246,949, Alcombe at an average of £277,769 and Minehead North at an average of £285,806.
Which train stations are available in or near Minehead?
Some of the train stations available in or near Minehead are Llantwit Major, Rhoose (Cardiff Int Airpt) and Barry.
Property Price Paid in Minehead by Year
The average sold property price by year was:
| Year | Average Sold Price | Price Change |
Sold Properties
|
|---|---|---|---|
| 2024 | £306,315 | -8% |
20 Properties |
| 2023 | £329,292 | 3% |
253 Properties |
| 2022 | £318,195 | 5% |
358 Properties |
| 2021 | £301,394 | 10% |
490 Properties |
| 2020 | £271,092 | -2% |
324 Properties |
| 2019 | £277,797 | 7% |
309 Properties |
| 2018 | £257,502 | 1% |
392 Properties |
| 2017 | £255,598 | 13% |
479 Properties |
| 2016 | £222,927 | 6% |
485 Properties |
| 2015 | £209,064 | -7% |
413 Properties |
| 2014 | £224,203 | 4% |
432 Properties |
| 2013 | £215,837 | 2% |
322 Properties |
| 2012 | £211,502 | -10% |
282 Properties |
| 2011 | £232,273 | 3% |
320 Properties |
| 2010 | £224,335 | -1% |
311 Properties |
| 2009 | £225,918 | -12% |
282 Properties |
| 2008 | £253,126 | 13% |
264 Properties |
| 2007 | £220,569 | 5% |
538 Properties |
| 2006 | £209,369 | 7% |
555 Properties |
| 2005 | £193,719 | 2% |
392 Properties |
| 2004 | £189,960 | 6% |
549 Properties |
| 2003 | £179,347 | 19% |
531 Properties |
| 2002 | £145,241 | 19% |
544 Properties |
| 2001 | £117,621 | 16% |
492 Properties |
| 2000 | £98,479 | 13% |
466 Properties |
| 1999 | £85,866 | -0,1% |
508 Properties |
| 1998 | £85,917 | 14% |
454 Properties |
| 1997 | £73,979 | 2% |
548 Properties |
| 1996 | £72,496 | 5% |
429 Properties |
| 1995 | £68,849 | - |
322 Properties |
Property Price per Property Type in Minehead
Here you can find historic sold price data in order to help with your property search.
The average Property Paid Price for specific property types in the last three years are:
| Property Type | Average Sold Price | Sold Properties |
|---|---|---|
| Terraced House | £250,266.00 | 234 Terraced Houses |
| Flat | £172,413.00 | 258 Flats |
| Semi Detached House | £306,702.00 | 279 Semi Detached Houses |
| Detached House | £464,055.00 | 350 Detached Houses |