
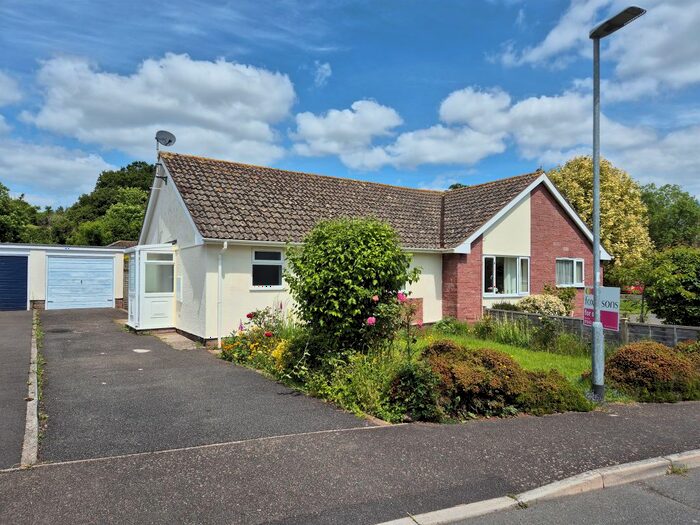
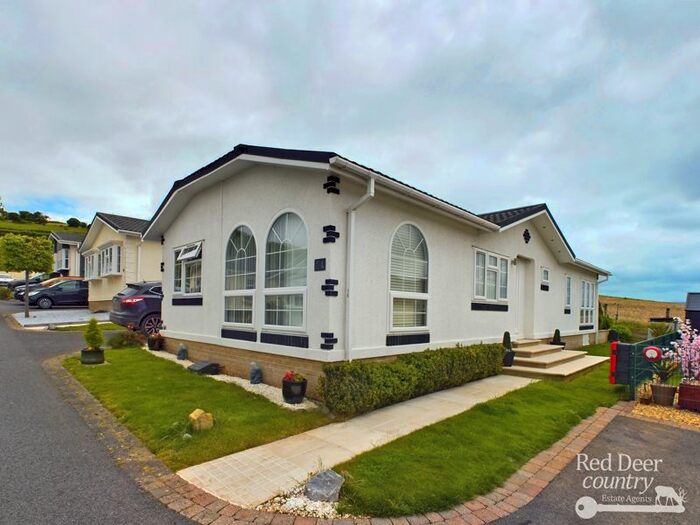
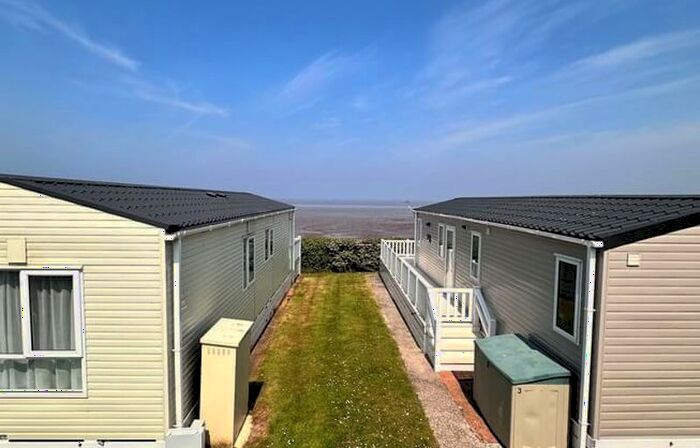
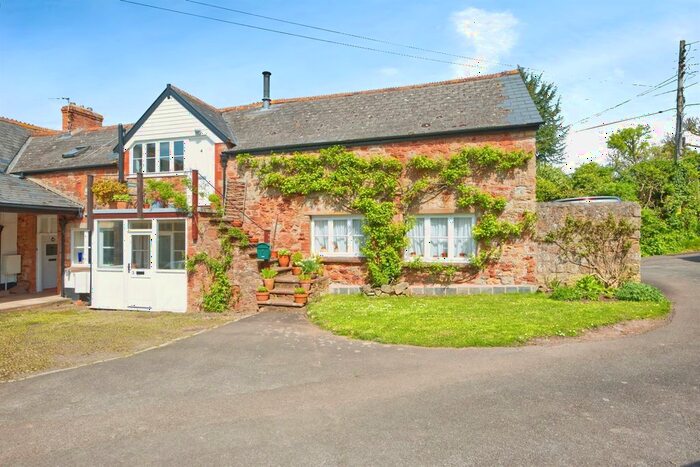
Houses for sale & to rent in Watchet, Somerset
House Prices in Watchet
Properties in Watchet have an average house price of £280,313.00 and had 287 Property Transactions within the last 3 years.¹
Watchet is an area in Somerset with 2,472 households², where the most expensive property was sold for £2,500,000.00.
Properties for sale in Watchet


Neighbourhoods in Watchet
Navigate through our locations to find the location of your next house in Watchet, Somerset for sale or to rent.
Transport in Watchet
Please see below transportation links in this area:
-
 Taunton Station
 -
Rhoose (Cardiff Int Airpt) Station
-
Bridgwater Station
-
Barry Island Station
-
Barry Station
-
Highbridge and Burnham Station
-
Tiverton Parkway Station
-
Barry Docks Station
-
Cadoxton Station
-
Llantwit Major Station
- FAQ
- Price Paid By Year
- Property Type Price
Frequently asked questions about Watchet
What is the average price for a property for sale in Watchet?
The average price for a property for sale in Watchet is £280,313. This amount is 13% lower than the average price in Somerset. There are 668 property listings for sale in Watchet.
What locations have the most expensive properties for sale in Watchet?
The locations with the most expensive properties for sale in Watchet are Williton at an average of £390,601, Old Cleeve at an average of £360,421 and Watchet & Williton at an average of £354,169.
What locations have the most affordable properties for sale in Watchet?
The locations with the most affordable properties for sale in Watchet are Watchet at an average of £236,871 and Old Cleeve & District at an average of £277,500.
Which train stations are available in or near Watchet?
Some of the train stations available in or near Watchet are Taunton, Rhoose (Cardiff Int Airpt) and Bridgwater.
Property Price Paid in Watchet by Year
The average sold property price by year was:
| Year | Average Sold Price | Price Change |
Sold Properties
|
|---|---|---|---|
| 2024 | £363,750 | 21% |
4 Properties |
| 2023 | £287,721 | -5% |
50 Properties |
| 2022 | £302,708 | 14% |
96 Properties |
| 2021 | £259,481 | 8% |
137 Properties |
| 2020 | £239,180 | 1% |
80 Properties |
| 2019 | £236,412 | -2% |
101 Properties |
| 2018 | £241,592 | 15% |
131 Properties |
| 2017 | £204,346 | 4% |
135 Properties |
| 2016 | £196,078 | -1% |
111 Properties |
| 2015 | £198,572 | -1% |
120 Properties |
| 2014 | £200,755 | 15% |
85 Properties |
| 2013 | £171,128 | 3% |
87 Properties |
| 2012 | £165,524 | -3% |
77 Properties |
| 2011 | £169,873 | -7% |
71 Properties |
| 2010 | £181,606 | -4% |
64 Properties |
| 2009 | £188,434 | 2% |
98 Properties |
| 2008 | £185,277 | -4% |
64 Properties |
| 2007 | £192,181 | 5% |
123 Properties |
| 2006 | £182,434 | 2% |
157 Properties |
| 2005 | £178,844 | 10% |
73 Properties |
| 2004 | £160,644 | 8% |
101 Properties |
| 2003 | £147,141 | 17% |
122 Properties |
| 2002 | £122,596 | 16% |
156 Properties |
| 2001 | £103,478 | 21% |
107 Properties |
| 2000 | £82,181 | 14% |
129 Properties |
| 1999 | £70,439 | -1% |
166 Properties |
| 1998 | £71,008 | 16% |
122 Properties |
| 1997 | £59,519 | 13% |
170 Properties |
| 1996 | £51,781 | -1% |
72 Properties |
| 1995 | £52,270 | - |
70 Properties |
Property Price per Property Type in Watchet
Here you can find historic sold price data in order to help with your property search.
The average Property Paid Price for specific property types in the last three years are:
| Property Type | Average Sold Price | Sold Properties |
|---|---|---|
| Flat | £158,645.00 | 31 Flats |
| Semi Detached House | £267,021.00 | 80 Semi Detached Houses |
| Terraced House | £218,135.00 | 102 Terraced Houses |
| Detached House | £431,357.00 | 74 Detached Houses |