
Houses for sale & to rent in Banbury, Warwickshire
House Prices in Banbury
Properties in Banbury have an average house price of £580,755.00 and had 109 Property Transactions within the last 3 years.¹
Banbury is an area in Warwickshire with 1,026 households², where the most expensive property was sold for £2,550,000.00.
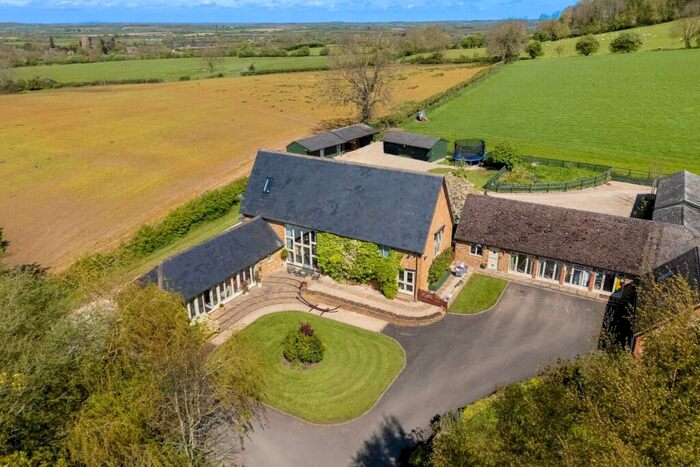
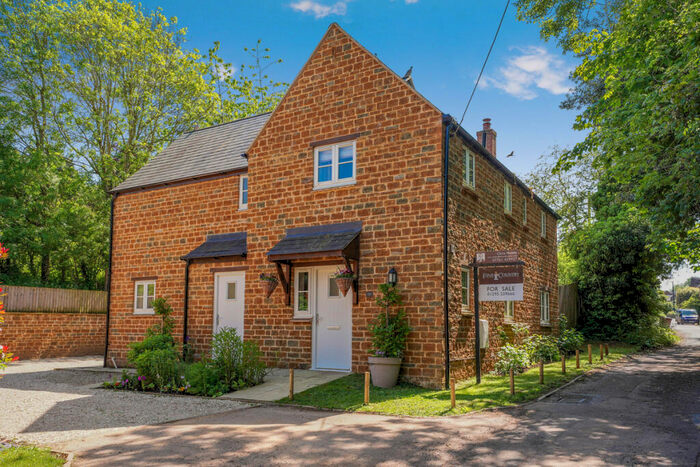
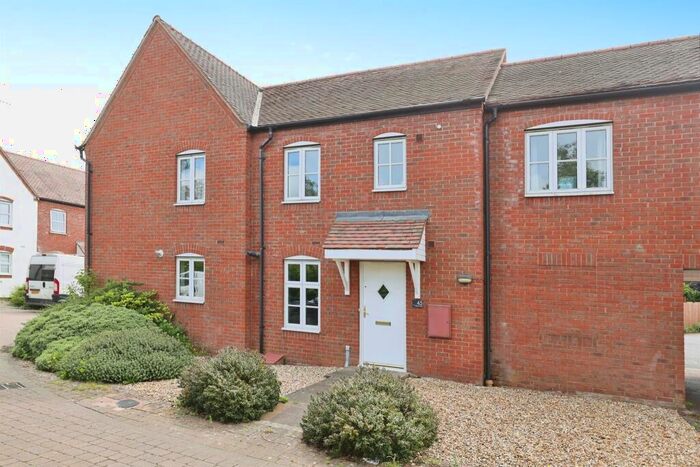
Properties for sale in Banbury


Neighbourhoods in Banbury
Navigate through our locations to find the location of your next house in Banbury, Warwickshire for sale or to rent.
Transport in Banbury
Please see below transportation links in this area:
-
 Banbury Station
 -
King's Sutton Station
-
Moreton-In-Marsh Station
-
Stratford-Upon-Avon Station
-
Leamington Spa Station
-
Stratford Pkway Station
-
Heyford Station
-
Warwick Station
-
Warwick Parkway Station
-
Kingham Station
- FAQ
- Price Paid By Year
- Property Type Price
Frequently asked questions about Banbury
What is the average price for a property for sale in Banbury?
The average price for a property for sale in Banbury is £580,755. This amount is 53% higher than the average price in Warwickshire. There are 3,754 property listings for sale in Banbury.
What locations have the most expensive properties for sale in Banbury?
The locations with the most expensive properties for sale in Banbury are Brailes & Compton at an average of £704,000 and Burton Dassett at an average of £609,197.
What locations have the most affordable properties for sale in Banbury?
The locations with the most affordable properties for sale in Banbury are Fenny Compton at an average of £522,927 and Brailes at an average of £527,419.
Which train stations are available in or near Banbury?
Some of the train stations available in or near Banbury are Banbury, King's Sutton and Moreton-In-Marsh.
Property Price Paid in Banbury by Year
The average sold property price by year was:
| Year | Average Sold Price | Price Change |
Sold Properties
|
|---|---|---|---|
| 2024 | £712,500 | 19% |
4 Properties |
| 2023 | £578,058 | -8% |
17 Properties |
| 2022 | £624,398 | 12% |
28 Properties |
| 2021 | £552,369 | 18% |
60 Properties |
| 2020 | £454,464 | 15% |
32 Properties |
| 2019 | £388,229 | 7% |
24 Properties |
| 2018 | £362,586 | -11% |
29 Properties |
| 2017 | £402,354 | -7% |
24 Properties |
| 2016 | £430,896 | -14% |
39 Properties |
| 2015 | £489,243 | 30% |
37 Properties |
| 2014 | £341,812 | -14% |
24 Properties |
| 2013 | £387,997 | 13% |
24 Properties |
| 2012 | £338,111 | -13% |
27 Properties |
| 2011 | £383,453 | -3% |
33 Properties |
| 2010 | £394,224 | 5% |
32 Properties |
| 2009 | £375,402 | -4% |
18 Properties |
| 2008 | £391,151 | 10% |
23 Properties |
| 2007 | £351,227 | -2% |
45 Properties |
| 2006 | £359,917 | 9% |
41 Properties |
| 2005 | £327,922 | -20% |
40 Properties |
| 2004 | £392,523 | 27% |
37 Properties |
| 2003 | £287,548 | -1% |
50 Properties |
| 2002 | £291,151 | 30% |
44 Properties |
| 2001 | £203,474 | 8% |
29 Properties |
| 2000 | £186,838 | 14% |
30 Properties |
| 1999 | £161,254 | 12% |
41 Properties |
| 1998 | £141,141 | 14% |
31 Properties |
| 1997 | £121,460 | 9% |
39 Properties |
| 1996 | £110,081 | -11% |
46 Properties |
| 1995 | £122,308 | - |
33 Properties |
Property Price per Property Type in Banbury
Here you can find historic sold price data in order to help with your property search.
The average Property Paid Price for specific property types in the last three years are:
| Property Type | Average Sold Price | Sold Properties |
|---|---|---|
| Semi Detached House | £384,387.00 | 29 Semi Detached Houses |
| Detached House | £770,553.00 | 55 Detached Houses |
| Terraced House | £390,985.00 | 25 Terraced Houses |