
Houses for sale & to rent in Shipston-on-stour, Warwickshire
House Prices in Shipston-on-stour
Properties in Shipston-on-stour have an average house price of £477,492.00 and had 515 Property Transactions within the last 3 years.¹
Shipston-on-stour is an area in Warwickshire with 4,398 households², where the most expensive property was sold for £9,300,000.00.
Properties for sale in Shipston-on-stour


Neighbourhoods in Shipston-on-stour
Navigate through our locations to find the location of your next house in Shipston-on-stour, Warwickshire for sale or to rent.
- Brailes
- Ettington
- Long Compton
- Quinton
- Shipston
- Tredington
- Vale Of The Red Horse
- Shipston North
- Shipston South
- Brailes & Compton
- Red Horse
- Clopton
- Guildhall
- Stratford Welcombe
- Stratford Tiddington
- Stratford Bishopton
- Claverdon & Snitterfield
- Wootton Wawen
- Stratford Clopton
- Long Marston
- Stratford Guildhall & Bridgetown
- Stratford Hathaway
- Welford-on-avon
Transport in Shipston-on-stour
Please see below transportation links in this area:

- FAQ
- Price Paid By Year
- Property Type Price
Frequently asked questions about Shipston-on-stour
What is the average price for a property for sale in Shipston-on-stour?
The average price for a property for sale in Shipston-on-stour is £477,492. This amount is 35% higher than the average price in Warwickshire. There are 6,872 property listings for sale in Shipston-on-stour.
What locations have the most expensive properties for sale in Shipston-on-stour?
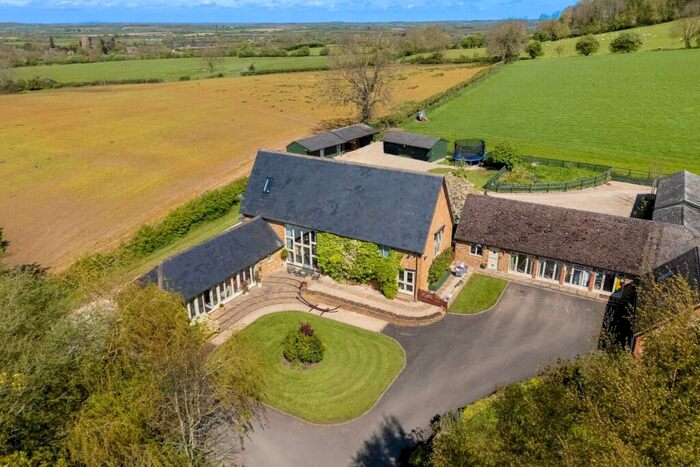
The locations with the most expensive properties for sale in Shipston-on-stour are Long Compton at an average of £891,089, Quinton at an average of £750,000 and Brailes at an average of £648,935.
What locations have the most affordable properties for sale in Shipston-on-stour?
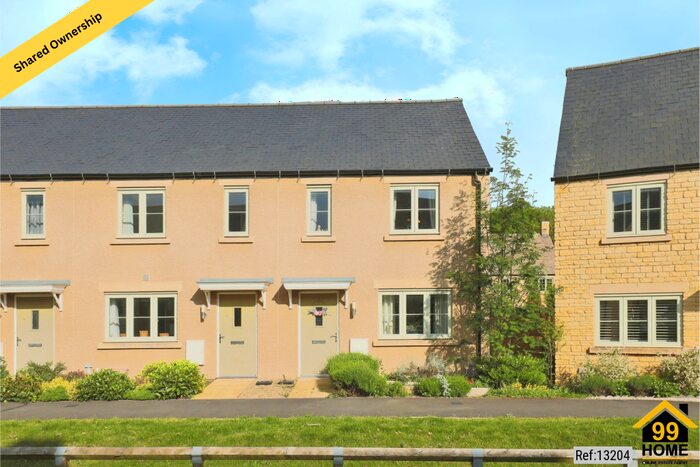
The locations with the most affordable properties for sale in Shipston-on-stour are Shipston at an average of £330,095, Shipston South at an average of £353,510 and Guildhall at an average of £387,000.
Which train stations are available in or near Shipston-on-stour?
Some of the train stations available in or near Shipston-on-stour are Moreton-In-Marsh, Stratford-Upon-Avon and Honeybourne.
Property Price Paid in Shipston-on-stour by Year
The average sold property price by year was:
| Year | Average Sold Price | Price Change |
Sold Properties
|
|---|---|---|---|
| 2024 | £301,666 | -53% |
3 Properties |
| 2023 | £461,941 | -15% |
117 Properties |
| 2022 | £528,972 | 15% |
169 Properties |
| 2021 | £449,381 | 4% |
226 Properties |
| 2020 | £430,516 | 9% |
253 Properties |
| 2019 | £391,132 | 4% |
231 Properties |
| 2018 | £373,661 | -6% |
222 Properties |
| 2017 | £394,924 | 8% |
177 Properties |
| 2016 | £365,007 | 9% |
189 Properties |
| 2015 | £332,979 | 5% |
189 Properties |
| 2014 | £316,640 | 5% |
159 Properties |
| 2013 | £302,320 | 8% |
151 Properties |
| 2012 | £279,097 | -4% |
134 Properties |
| 2011 | £289,248 | -8% |
145 Properties |
| 2010 | £311,910 | 7% |
149 Properties |
| 2009 | £289,390 | -9% |
112 Properties |
| 2008 | £314,467 | 6% |
97 Properties |
| 2007 | £295,736 | 4% |
192 Properties |
| 2006 | £283,525 | 9% |
270 Properties |
| 2005 | £258,224 | 6% |
186 Properties |
| 2004 | £243,062 | 6% |
254 Properties |
| 2003 | £228,365 | 11% |
266 Properties |
| 2002 | £202,968 | 5% |
259 Properties |
| 2001 | £192,117 | 16% |
205 Properties |
| 2000 | £162,258 | 17% |
226 Properties |
| 1999 | £134,785 | 5% |
264 Properties |
| 1998 | £127,983 | 18% |
207 Properties |
| 1997 | £105,172 | -1% |
195 Properties |
| 1996 | £106,327 | 8% |
193 Properties |
| 1995 | £97,392 | - |
141 Properties |
Property Price per Property Type in Shipston-on-stour
Here you can find historic sold price data in order to help with your property search.
The average Property Paid Price for specific property types in the last three years are:
| Property Type | Average Sold Price | Sold Properties |
|---|---|---|
| Semi Detached House | £390,693.00 | 122 Semi Detached Houses |
| Terraced House | £327,646.00 | 120 Terraced Houses |
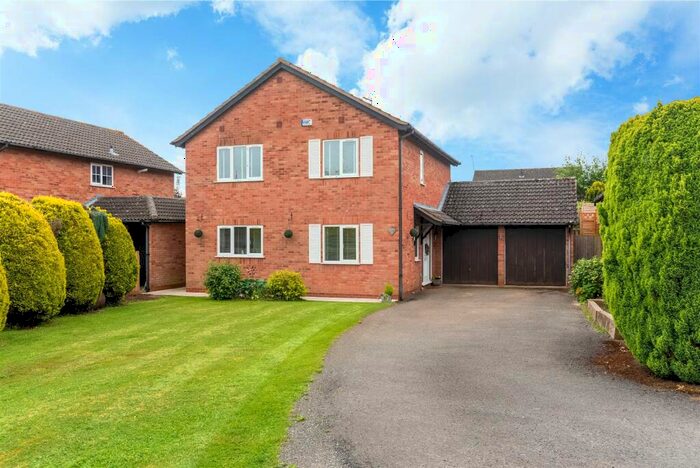
| Detached House | £649,107.00 | 232 Detached Houses |
| Flat | £203,256.00 | 41 Flats |