
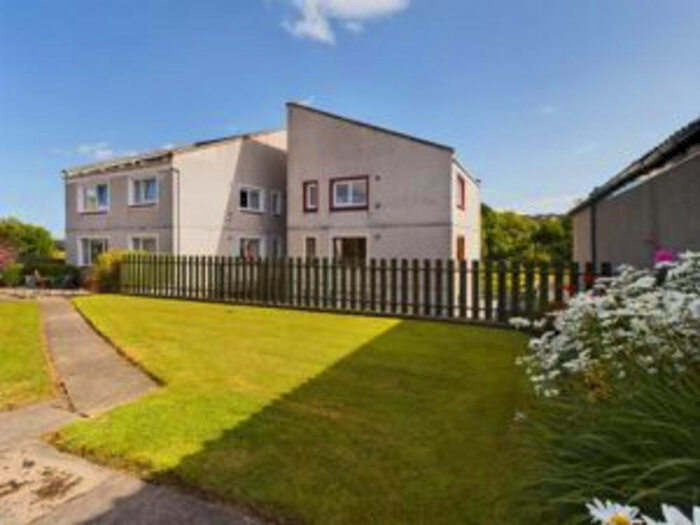
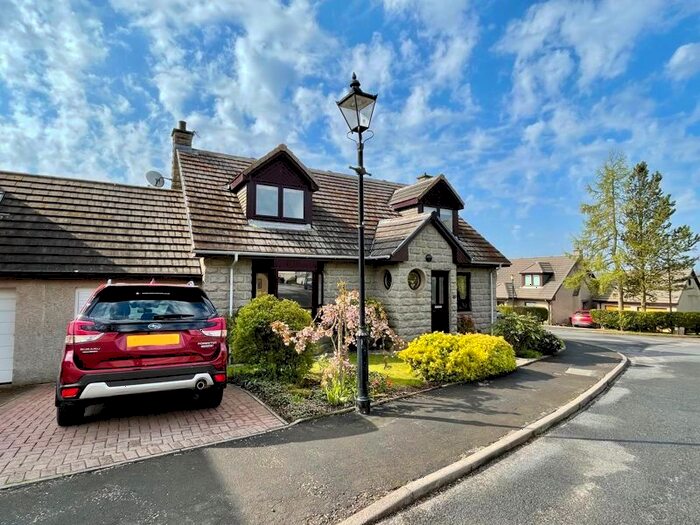
Houses for sale & to rent in Ellon, Aberdeenshire
House Prices in Ellon
Properties in Ellon have an average house price of £233,546.00 and had 932 Property Transactions within the last 3 years.¹
Ellon is an area in Aberdeenshire with 8,515 households², where the most expensive property was sold for £1,350,000.00.
Properties for sale in Ellon


Neighbourhoods in Ellon
Navigate through our locations to find the location of your next house in Ellon, Aberdeenshire for sale or to rent.
Transport in Ellon
Please see below transportation links in this area:

- FAQ
- Price Paid By Year
Frequently asked questions about Ellon
What is the average price for a property for sale in Ellon?
The average price for a property for sale in Ellon is £233,546. This amount is 4% higher than the average price in Aberdeenshire. There are 1,808 property listings for sale in Ellon.
What locations have the most expensive properties for sale in Ellon?
The locations with the most expensive properties for sale in Ellon are Turriff and District at an average of £263,335 and Central Buchan at an average of £261,372.
What locations have the most affordable properties for sale in Ellon?
The locations with the most affordable properties for sale in Ellon are Ellon and District at an average of £226,921 and Mid Formartine at an average of £244,142.
Which train stations are available in or near Ellon?
Some of the train stations available in or near Ellon are Inverurie, Dyce and Aberdeen.
Property Price Paid in Ellon by Year
The average sold property price by year was:
| Year | Average Sold Price | Price Change |
Sold Properties
|
|---|---|---|---|
| 2023 | £244,363 | 1% |
55 Properties |
| 2022 | £241,611 | 6% |
357 Properties |
| 2021 | £226,864 | 4% |
520 Properties |
| 2020 | £217,330 | 0,3% |
300 Properties |
| 2019 | £216,709 | 1% |
353 Properties |
| 2018 | £213,986 | 4% |
311 Properties |
| 2017 | £206,424 | -4% |
344 Properties |
| 2016 | £214,044 | -7% |
319 Properties |
| 2015 | £228,021 | - |
478 Properties |
| 2014 | £227,934 | 5% |
522 Properties |
| 2013 | £216,976 | 8% |
405 Properties |
| 2012 | £199,879 | 2% |
328 Properties |
| 2011 | £196,239 | -10% |
254 Properties |
| 2010 | £215,452 | 11% |
318 Properties |
| 2009 | £191,090 | -1% |
386 Properties |
| 2008 | £192,759 | -1% |
351 Properties |
| 2007 | £194,195 | 18% |
362 Properties |
| 2006 | £159,949 | 24% |
441 Properties |
| 2005 | £121,825 | 5% |
490 Properties |
| 2004 | £115,494 | 15% |
519 Properties |
| 2003 | £97,748 | 12% |
558 Properties |
| 2002 | £86,032 | 13% |
567 Properties |
| 2001 | £74,787 | - |
40 Properties |