
Houses for sale & to rent in Turriff, Aberdeenshire
House Prices in Turriff
Properties in Turriff have an average house price of £183,208.00 and had 480 Property Transactions within the last 3 years.¹
Turriff is an area in Aberdeenshire with 5,306 households², where the most expensive property was sold for £555,000.00.
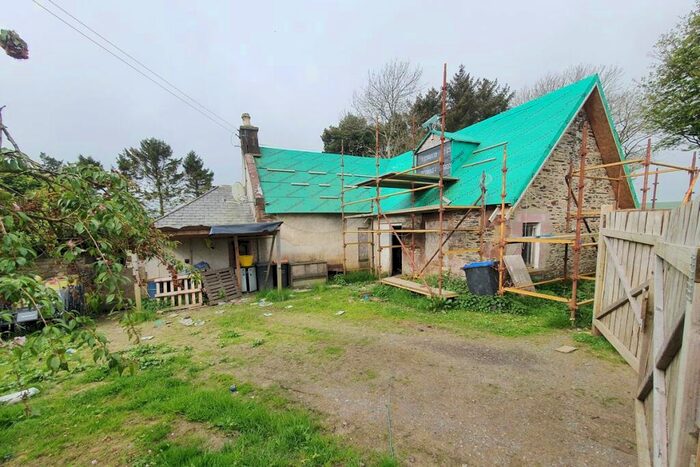
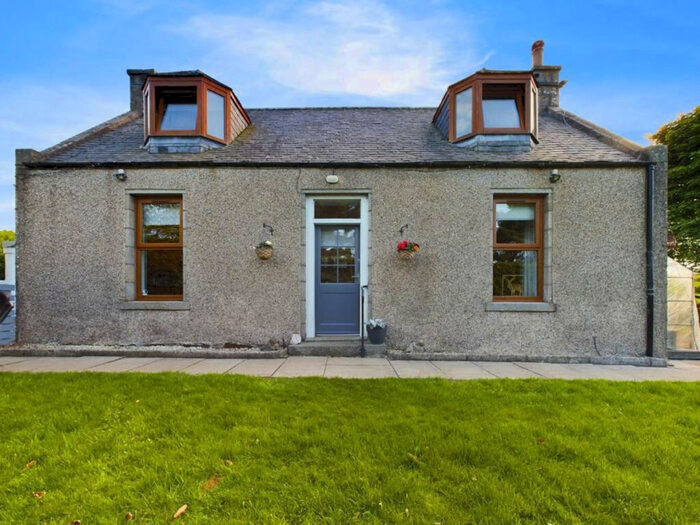
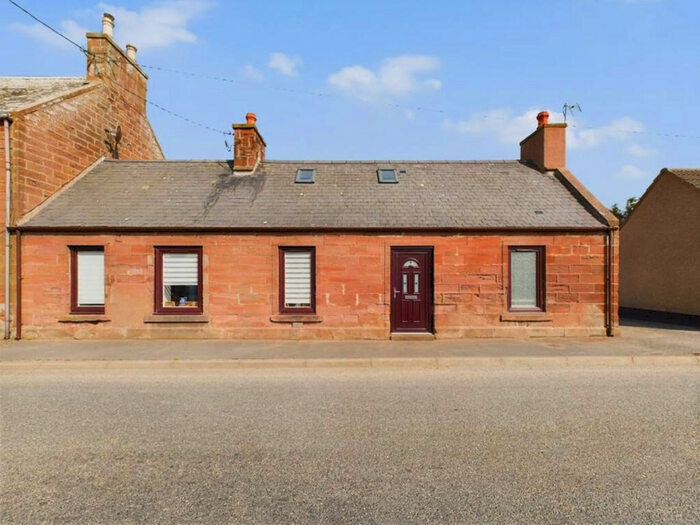
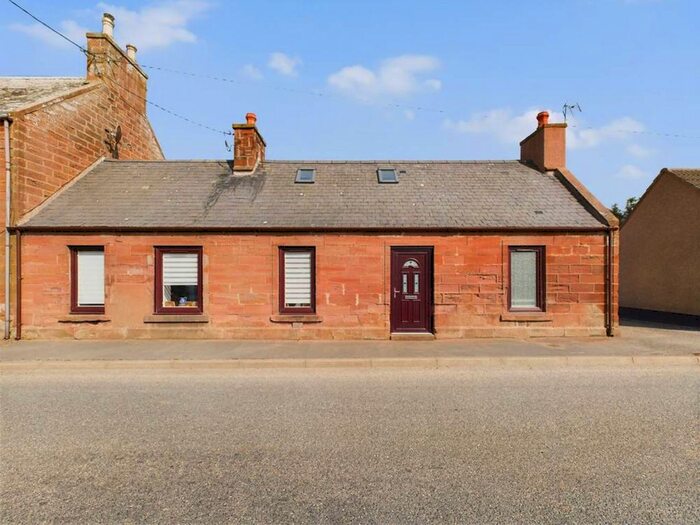
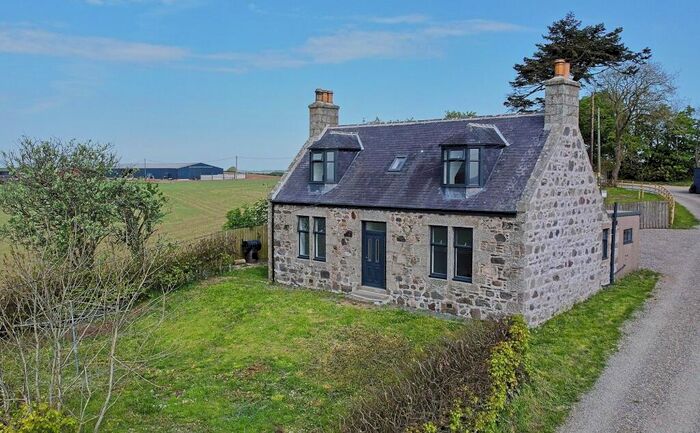
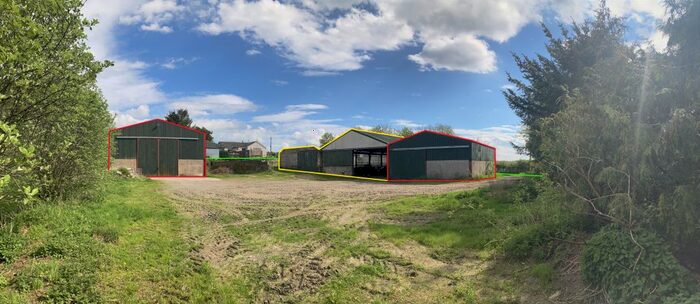
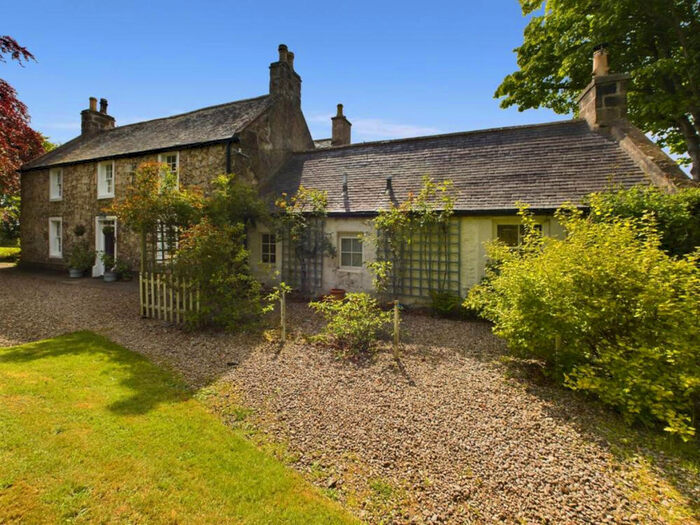
Properties for sale in Turriff


Neighbourhoods in Turriff
Navigate through our locations to find the location of your next house in Turriff, Aberdeenshire for sale or to rent.
Transport in Turriff
Please see below transportation links in this area:

- FAQ
- Price Paid By Year
Frequently asked questions about Turriff
What is the average price for a property for sale in Turriff?
The average price for a property for sale in Turriff is £183,208. This amount is 20% lower than the average price in Aberdeenshire. There are 797 property listings for sale in Turriff.
What locations have the most expensive properties for sale in Turriff?
The locations with the most expensive properties for sale in Turriff are Banff and District at an average of £235,819 and Central Buchan at an average of £198,320.
What locations have the most affordable properties for sale in Turriff?
The locations with the most affordable properties for sale in Turriff are Troup at an average of £172,249 and Turriff and District at an average of £179,625.
Which train stations are available in or near Turriff?
Some of the train stations available in or near Turriff are Huntly, Insch and Inverurie.
Property Price Paid in Turriff by Year
The average sold property price by year was:
| Year | Average Sold Price | Price Change |
Sold Properties
|
|---|---|---|---|
| 2023 | £192,186 | 5% |
33 Properties |
| 2022 | £182,636 | 0,1% |
186 Properties |
| 2021 | £182,481 | 0,3% |
261 Properties |
| 2020 | £181,895 | 2% |
168 Properties |
| 2019 | £177,646 | 1% |
165 Properties |
| 2018 | £176,145 | 2% |
153 Properties |
| 2017 | £173,415 | 1% |
180 Properties |
| 2016 | £170,945 | -7% |
160 Properties |
| 2015 | £182,300 | 3% |
205 Properties |
| 2014 | £177,733 | 1% |
255 Properties |
| 2013 | £175,174 | 15% |
183 Properties |
| 2012 | £148,562 | -11% |
175 Properties |
| 2011 | £164,980 | 6% |
157 Properties |
| 2010 | £155,684 | 6% |
159 Properties |
| 2009 | £146,806 | -2% |
192 Properties |
| 2008 | £149,950 | -16% |
176 Properties |
| 2007 | £173,337 | 23% |
233 Properties |
| 2006 | £132,892 | 10% |
273 Properties |
| 2005 | £119,322 | 17% |
264 Properties |
| 2004 | £99,561 | 32% |
251 Properties |
| 2003 | £67,871 | 2% |
295 Properties |
| 2002 | £66,699 | 12% |
303 Properties |
| 2001 | £58,728 | - |
19 Properties |