
Houses for sale & to rent in Ammanford, Sir Gaerfyrddin - Carmarthenshire
House Prices in Ammanford
Properties in Ammanford have an average house price of £192,260.00 and had 1,208 Property Transactions within the last 3 years.¹
Ammanford is an area in Sir Gaerfyrddin - Carmarthenshire with 10,866 households², where the most expensive property was sold for £1,750,000.00.
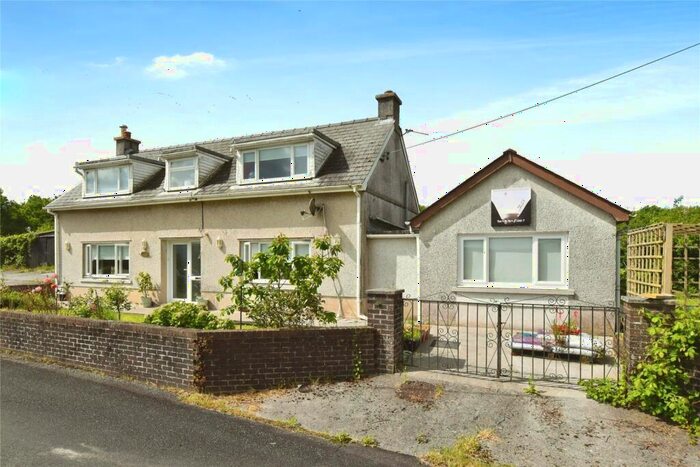
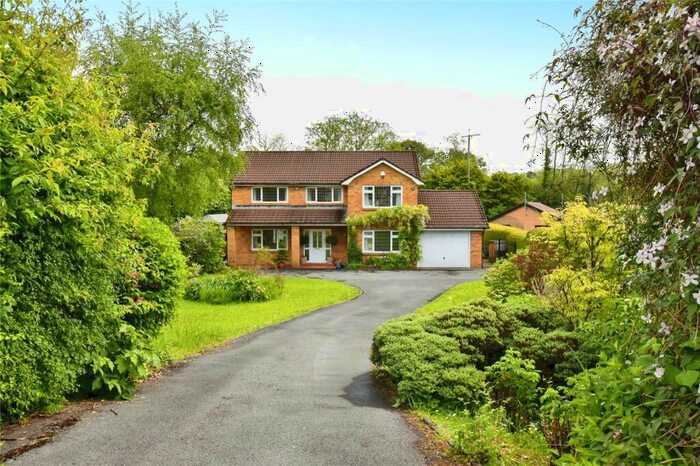
Properties for sale in Ammanford


Neighbourhoods in Ammanford
Navigate through our locations to find the location of your next house in Ammanford, Sir Gaerfyrddin - Carmarthenshire for sale or to rent.
Transport in Ammanford
Please see below transportation links in this area:

- FAQ
- Price Paid By Year
- Property Type Price
Frequently asked questions about Ammanford
What is the average price for a property for sale in Ammanford?
The average price for a property for sale in Ammanford is £192,260. This amount is 6% lower than the average price in Sir Gaerfyrddin - Carmarthenshire. There are 5,565 property listings for sale in Ammanford.
What locations have the most expensive properties for sale in Ammanford?
The locations with the most expensive properties for sale in Ammanford are Llanfihangel Aberbythych at an average of £592,000, Llandeilo at an average of £307,400 and Llandybie at an average of £236,725.
What locations have the most affordable properties for sale in Ammanford?
The locations with the most affordable properties for sale in Ammanford are Quarter Bach at an average of £145,064, Glanamman at an average of £159,789 and Ammanford at an average of £164,276.
Which train stations are available in or near Ammanford?
Some of the train stations available in or near Ammanford are Ammanford, Pantyffynnon and Llandybie.
Property Price Paid in Ammanford by Year
The average sold property price by year was:
| Year | Average Sold Price | Price Change |
Sold Properties
|
|---|---|---|---|
| 2024 | £174,646 | -6% |
27 Properties |
| 2023 | £185,944 | -11% |
258 Properties |
| 2022 | £205,686 | 10% |
397 Properties |
| 2021 | £186,128 | 20% |
526 Properties |
| 2020 | £148,448 | 0,1% |
358 Properties |
| 2019 | £148,287 | 7% |
414 Properties |
| 2018 | £138,632 | 1% |
438 Properties |
| 2017 | £137,673 | 3% |
428 Properties |
| 2016 | £132,866 | 1% |
409 Properties |
| 2015 | £131,029 | 2% |
346 Properties |
| 2014 | £127,858 | 10% |
320 Properties |
| 2013 | £115,268 | -5% |
256 Properties |
| 2012 | £120,550 | -8% |
281 Properties |
| 2011 | £129,601 | -1% |
270 Properties |
| 2010 | £130,452 | 6% |
272 Properties |
| 2009 | £122,402 | -14% |
221 Properties |
| 2008 | £139,710 | 1% |
280 Properties |
| 2007 | £138,166 | 3% |
505 Properties |
| 2006 | £133,651 | 8% |
501 Properties |
| 2005 | £122,481 | 12% |
418 Properties |
| 2004 | £108,239 | 24% |
459 Properties |
| 2003 | £82,554 | 25% |
484 Properties |
| 2002 | £61,756 | 14% |
496 Properties |
| 2001 | £53,304 | 13% |
464 Properties |
| 2000 | £46,639 | 4% |
381 Properties |
| 1999 | £44,992 | 0,1% |
299 Properties |
| 1998 | £44,942 | 6% |
316 Properties |
| 1997 | £42,077 | 9% |
332 Properties |
| 1996 | £38,269 | -8% |
264 Properties |
| 1995 | £41,222 | - |
214 Properties |
Property Price per Property Type in Ammanford
Here you can find historic sold price data in order to help with your property search.
The average Property Paid Price for specific property types in the last three years are:
| Property Type | Average Sold Price | Sold Properties |
|---|---|---|
| Semi Detached House | £157,582.00 | 495 Semi Detached Houses |
| Terraced House | £133,352.00 | 229 Terraced Houses |
| Detached House | £262,386.00 | 466 Detached Houses |
| Flat | £79,858.00 | 18 Flats |