
Houses for sale & to rent in Llanelli, Sir Gaerfyrddin - Carmarthenshire
House Prices in Llanelli
Properties in Llanelli have an average house price of £170,697.00 and had 3,351 Property Transactions within the last 3 years.¹
Llanelli is an area in Sir Gaerfyrddin - Carmarthenshire with 30,329 households², where the most expensive property was sold for £899,950.00.
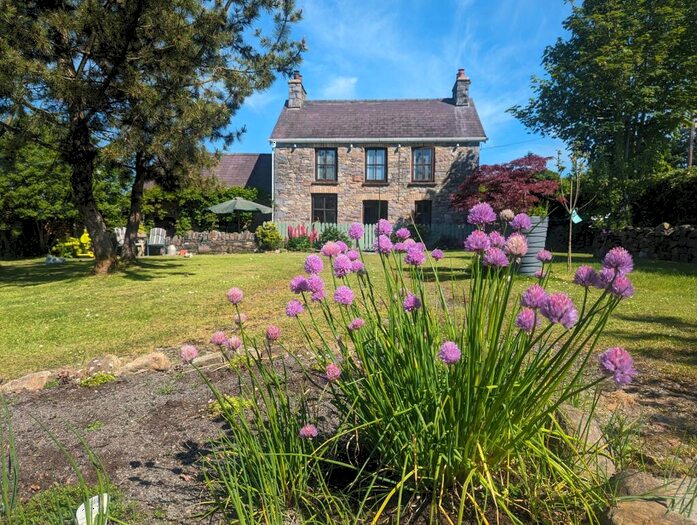
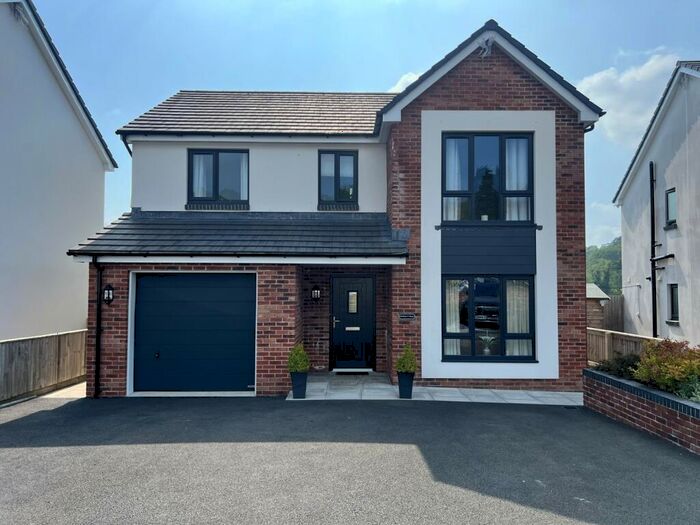
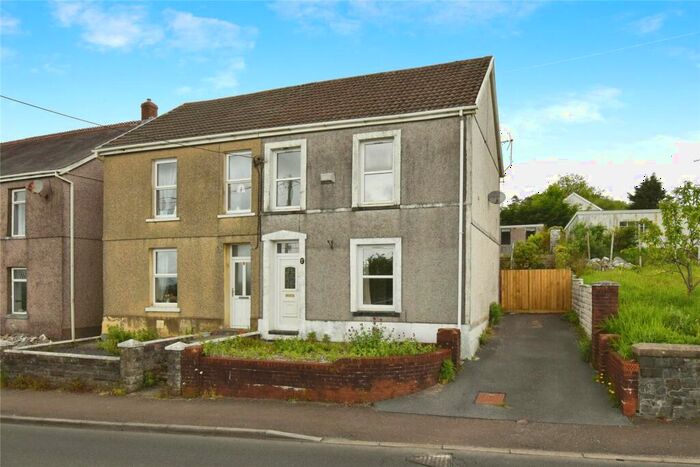
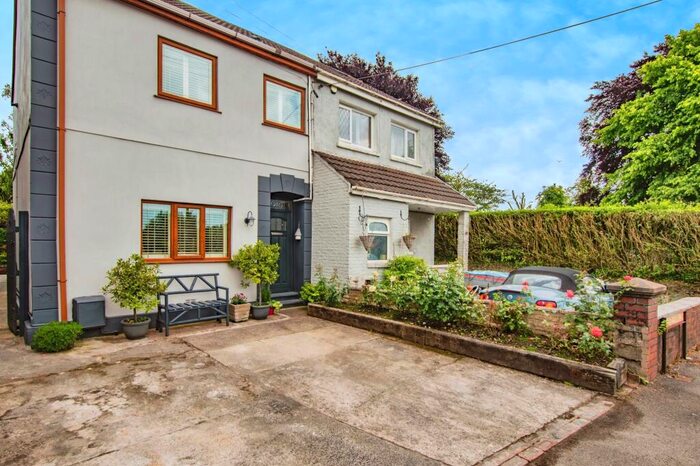
Properties for sale in Llanelli


Neighbourhoods in Llanelli
Navigate through our locations to find the location of your next house in Llanelli, Sir Gaerfyrddin - Carmarthenshire for sale or to rent.
Transport in Llanelli
Please see below transportation links in this area:

- FAQ
- Price Paid By Year
- Property Type Price
Frequently asked questions about Llanelli
What is the average price for a property for sale in Llanelli?
The average price for a property for sale in Llanelli is £170,697. This amount is 18% lower than the average price in Sir Gaerfyrddin - Carmarthenshire. There are more than 10,000 property listings for sale in Llanelli.
What locations have the most expensive properties for sale in Llanelli?
The locations with the most expensive properties for sale in Llanelli are Llanddarog at an average of £278,550, Llanfihangel Aberbythych at an average of £269,996 and Trimsaran at an average of £248,572.
What locations have the most affordable properties for sale in Llanelli?
The locations with the most affordable properties for sale in Llanelli are Tyisha at an average of £102,359, Llwynhendy at an average of £132,161 and Bigyn at an average of £133,711.
Which train stations are available in or near Llanelli?
Some of the train stations available in or near Llanelli are Llanelli, Llangennech and Bynea.
Property Price Paid in Llanelli by Year
The average sold property price by year was:
| Year | Average Sold Price | Price Change |
Sold Properties
|
|---|---|---|---|
| 2024 | £165,554 | -9% |
55 Properties |
| 2023 | £180,917 | 3% |
829 Properties |
| 2022 | £175,429 | 9% |
1,151 Properties |
| 2021 | £160,335 | 9% |
1,316 Properties |
| 2020 | £145,198 | 4% |
949 Properties |
| 2019 | £140,077 | 1% |
1,324 Properties |
| 2018 | £138,381 | 6% |
1,259 Properties |
| 2017 | £130,472 | 1% |
1,254 Properties |
| 2016 | £129,756 | -1% |
1,210 Properties |
| 2015 | £130,552 | 1% |
1,079 Properties |
| 2014 | £128,935 | 4% |
1,169 Properties |
| 2013 | £123,584 | -0,2% |
857 Properties |
| 2012 | £123,805 | 2% |
699 Properties |
| 2011 | £121,385 | -0,2% |
674 Properties |
| 2010 | £121,620 | -5% |
707 Properties |
| 2009 | £127,727 | -2% |
597 Properties |
| 2008 | £130,678 | -7% |
675 Properties |
| 2007 | £140,008 | 10% |
1,369 Properties |
| 2006 | £126,404 | 6% |
1,554 Properties |
| 2005 | £119,067 | 13% |
1,158 Properties |
| 2004 | £103,871 | 25% |
1,279 Properties |
| 2003 | £78,255 | 26% |
1,414 Properties |
| 2002 | £57,699 | 13% |
1,355 Properties |
| 2001 | £50,082 | 7% |
1,150 Properties |
| 2000 | £46,681 | 3% |
1,064 Properties |
| 1999 | £45,110 | 4% |
856 Properties |
| 1998 | £43,462 | 5% |
892 Properties |
| 1997 | £41,132 | 2% |
924 Properties |
| 1996 | £40,316 | 4% |
840 Properties |
| 1995 | £38,541 | - |
689 Properties |
Property Price per Property Type in Llanelli
Here you can find historic sold price data in order to help with your property search.
The average Property Paid Price for specific property types in the last three years are:
| Property Type | Average Sold Price | Sold Properties |
|---|---|---|
| Terraced House | £122,891.00 | 1,236 Terraced Houses |
| Flat | £96,394.00 | 106 Flats |
| Semi Detached House | £154,330.00 | 1,194 Semi Detached Houses |
| Detached House | £276,839.00 | 815 Detached Houses |