
Houses for sale & to rent in Radstock, Bath and North East Somerset
House Prices in Radstock
Properties in Radstock have an average house price of £290,372.00 and had 1,035 Property Transactions within the last 3 years.¹
Radstock is an area in Bath and North East Somerset with 9,197 households², where the most expensive property was sold for £1,500,000.00.
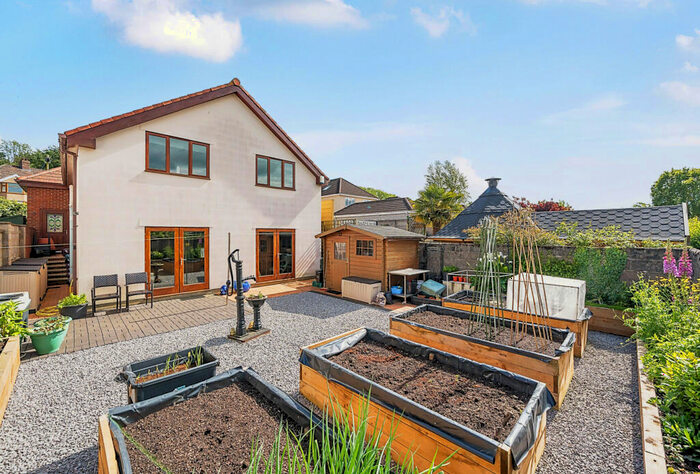
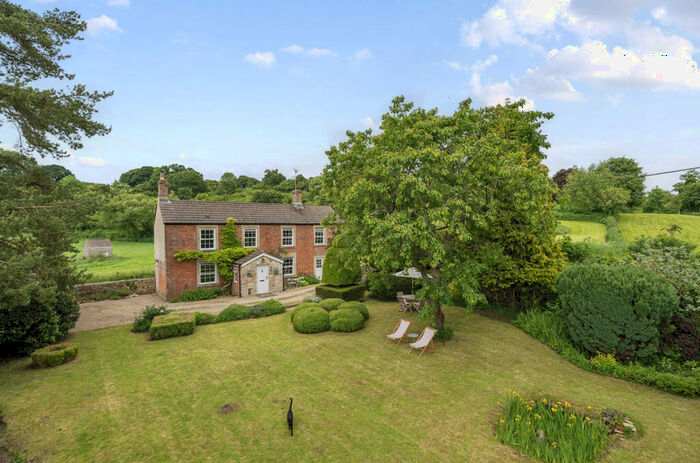
Properties for sale in Radstock


Neighbourhoods in Radstock
Navigate through our locations to find the location of your next house in Radstock, Bath and North East Somerset for sale or to rent.
Transport in Radstock
Please see below transportation links in this area:
-
 Oldfield Park Station
 -
Bath Spa Station
-
Frome Station
-
Freshford Station
-
Avoncliff Station
-
Keynsham Station
- FAQ
- Price Paid By Year
- Property Type Price
Frequently asked questions about Radstock
What is the average price for a property for sale in Radstock?
The average price for a property for sale in Radstock is £290,372. This amount is 49% lower than the average price in Bath and North East Somerset. There are 4,193 property listings for sale in Radstock.
What locations have the most expensive properties for sale in Radstock?
The locations with the most expensive properties for sale in Radstock are Mendip at an average of £1,500,000, Midsomer Norton Redfield at an average of £329,449 and Midsomer Norton North at an average of £286,456.
What locations have the most affordable properties for sale in Radstock?
The locations with the most affordable properties for sale in Radstock are Radstock at an average of £270,238 and Westfield at an average of £274,799.
Which train stations are available in or near Radstock?
Some of the train stations available in or near Radstock are Oldfield Park, Bath Spa and Frome.
Property Price Paid in Radstock by Year
The average sold property price by year was:
| Year | Average Sold Price | Price Change |
Sold Properties
|
|---|---|---|---|
| 2024 | £282,500 | -9% |
11 Properties |
| 2023 | £307,489 | 3% |
244 Properties |
| 2022 | £299,478 | 9% |
363 Properties |
| 2021 | £272,638 | 8% |
417 Properties |
| 2020 | £250,595 | -1% |
304 Properties |
| 2019 | £254,225 | 3% |
414 Properties |
| 2018 | £247,302 | 5% |
534 Properties |
| 2017 | £235,391 | 5% |
434 Properties |
| 2016 | £222,947 | 10% |
439 Properties |
| 2015 | £199,572 | 3% |
471 Properties |
| 2014 | £192,897 | 3% |
443 Properties |
| 2013 | £187,180 | 9% |
384 Properties |
| 2012 | £170,779 | -2% |
307 Properties |
| 2011 | £174,229 | -0,5% |
270 Properties |
| 2010 | £175,052 | 3% |
311 Properties |
| 2009 | £168,985 | -5% |
297 Properties |
| 2008 | £176,829 | -10% |
225 Properties |
| 2007 | £195,054 | 12% |
492 Properties |
| 2006 | £172,571 | 3% |
568 Properties |
| 2005 | £168,222 | 9% |
434 Properties |
| 2004 | £152,392 | 9% |
531 Properties |
| 2003 | £139,319 | 20% |
461 Properties |
| 2002 | £111,014 | 19% |
509 Properties |
| 2001 | £89,565 | 11% |
516 Properties |
| 2000 | £80,145 | 10% |
438 Properties |
| 1999 | £72,248 | 6% |
571 Properties |
| 1998 | £68,058 | 16% |
437 Properties |
| 1997 | £57,185 | 5% |
465 Properties |
| 1996 | £54,437 | 6% |
438 Properties |
| 1995 | £51,381 | - |
333 Properties |
Property Price per Property Type in Radstock
Here you can find historic sold price data in order to help with your property search.
The average Property Paid Price for specific property types in the last three years are:
| Property Type | Average Sold Price | Sold Properties |
|---|---|---|
| Semi Detached House | £284,738.00 | 324 Semi Detached Houses |
| Terraced House | £240,930.00 | 355 Terraced Houses |
| Detached House | £414,713.00 | 260 Detached Houses |
| Flat | £155,466.00 | 96 Flats |