
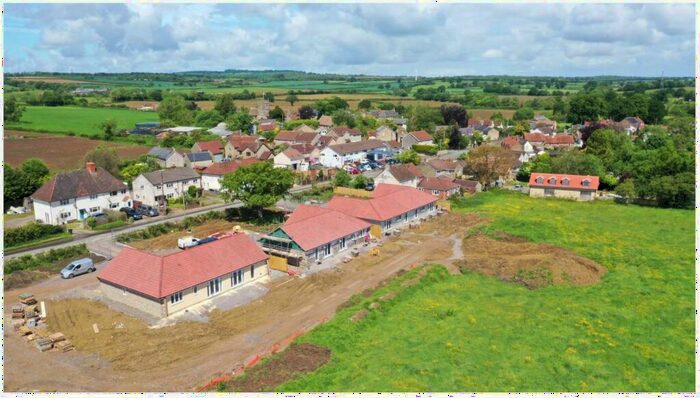
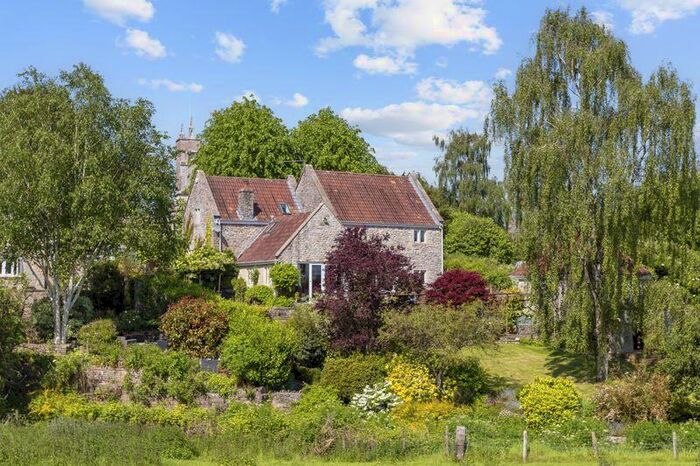
Houses for sale & to rent in Shepton Mallet, Somerset
House Prices in Shepton Mallet
Properties in Shepton Mallet have an average house price of £345,280.00 and had 812 Property Transactions within the last 3 years.¹
Shepton Mallet is an area in Somerset with 7,445 households², where the most expensive property was sold for £4,414,865.00.
Properties for sale in Shepton Mallet


Neighbourhoods in Shepton Mallet
Navigate through our locations to find the location of your next house in Shepton Mallet, Somerset for sale or to rent.
Transport in Shepton Mallet
Please see below transportation links in this area:

- FAQ
- Price Paid By Year
- Property Type Price
Frequently asked questions about Shepton Mallet
What is the average price for a property for sale in Shepton Mallet?
The average price for a property for sale in Shepton Mallet is £345,280. This amount is 7% higher than the average price in Somerset. There are 5,239 property listings for sale in Shepton Mallet.
What locations have the most expensive properties for sale in Shepton Mallet?
The locations with the most expensive properties for sale in Shepton Mallet are Postlebury at an average of £709,028, Croscombe And Pilton at an average of £664,591 and The Pennards And Ditcheat at an average of £649,776.
What locations have the most affordable properties for sale in Shepton Mallet?
The locations with the most affordable properties for sale in Shepton Mallet are Shepton East at an average of £248,233, Shepton West at an average of £254,361 and Creech at an average of £331,436.
Which train stations are available in or near Shepton Mallet?
Some of the train stations available in or near Shepton Mallet are Castle Cary, Bruton and Frome.
Property Price Paid in Shepton Mallet by Year
The average sold property price by year was:
| Year | Average Sold Price | Price Change |
Sold Properties
|
|---|---|---|---|
| 2024 | £458,934 | 23% |
23 Properties |
| 2023 | £354,087 | -8% |
189 Properties |
| 2022 | £382,459 | 21% |
262 Properties |
| 2021 | £303,802 | 1% |
338 Properties |
| 2020 | £302,235 | 14% |
243 Properties |
| 2019 | £260,921 | -6% |
263 Properties |
| 2018 | £275,331 | 9% |
308 Properties |
| 2017 | £250,652 | 4% |
347 Properties |
| 2016 | £240,561 | 8% |
344 Properties |
| 2015 | £220,995 | -3% |
393 Properties |
| 2014 | £228,207 | 6% |
343 Properties |
| 2013 | £214,873 | 7% |
262 Properties |
| 2012 | £199,141 | -0,3% |
240 Properties |
| 2011 | £199,810 | -7% |
235 Properties |
| 2010 | £214,330 | 9% |
231 Properties |
| 2009 | £196,101 | -6% |
233 Properties |
| 2008 | £208,037 | -4% |
243 Properties |
| 2007 | £216,892 | 15% |
462 Properties |
| 2006 | £184,447 | -2% |
490 Properties |
| 2005 | £188,057 | 5% |
338 Properties |
| 2004 | £179,103 | 8% |
404 Properties |
| 2003 | £164,219 | 14% |
405 Properties |
| 2002 | £141,340 | 14% |
476 Properties |
| 2001 | £121,165 | 17% |
451 Properties |
| 2000 | £100,683 | 9% |
390 Properties |
| 1999 | £91,167 | 16% |
404 Properties |
| 1998 | £76,987 | 7% |
353 Properties |
| 1997 | £71,903 | 9% |
368 Properties |
| 1996 | £65,544 | -2% |
295 Properties |
| 1995 | £66,960 | - |
217 Properties |
Property Price per Property Type in Shepton Mallet
Here you can find historic sold price data in order to help with your property search.
The average Property Paid Price for specific property types in the last three years are:
| Property Type | Average Sold Price | Sold Properties |
|---|---|---|
| Semi Detached House | £291,483.00 | 219 Semi Detached Houses |
| Terraced House | £239,370.00 | 231 Terraced Houses |
| Detached House | £573,118.00 | 255 Detached Houses |
| Flat | £141,053.00 | 107 Flats |